The banks have been rallying since August. Who expected the banks to make this massive run? Well, a hoard of technicians saw the breakout last fall, and it has been a smooth sustained rally. However, the yield curve spread (the distance between different yields) has been shrinking. As an example the 10 year minus the 2 year is narrowing. This puts pressure on bank earnings. So in a few charts we can see what is going on and what to watch for.
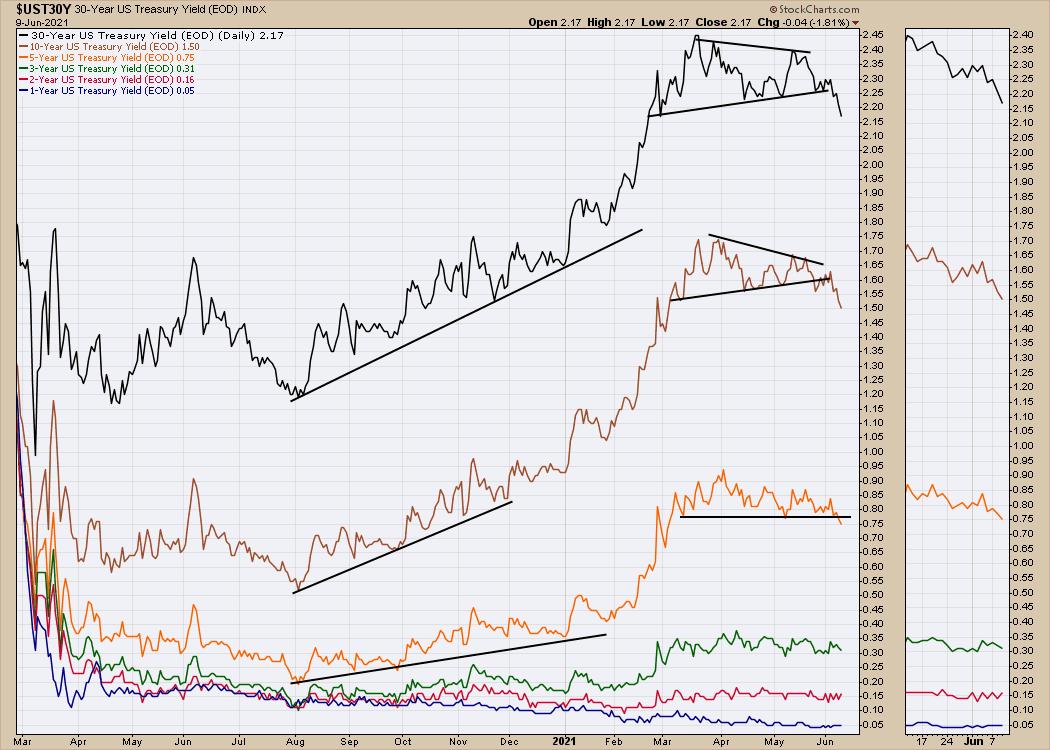
The yield curve is breaking down over the 30, 10, 5 year time frames.
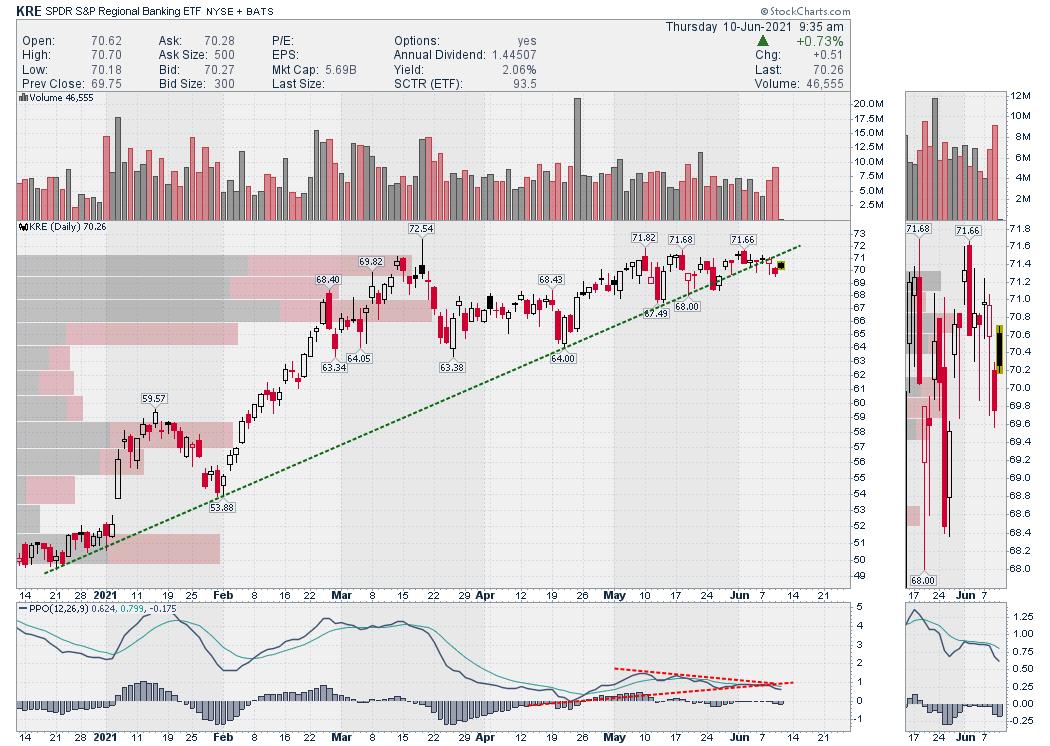
When I look at the Bank ETF’s they are starting to show the strain. This regional bank ETF is breaking the trend line and the PPO is threatening to go below zero suggesting negative momentum.
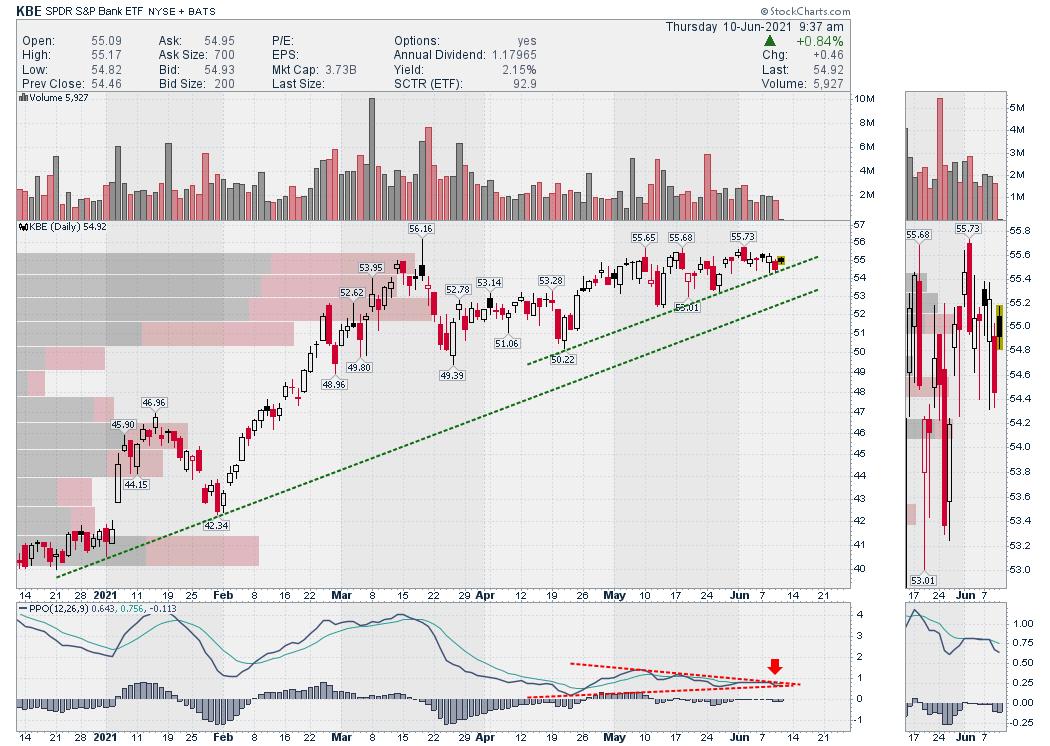
For the Big Bank ETF, the picture is a little brighter. It is not approaching the long term trend line yet, but the chart is up against the March highs like the chart above.
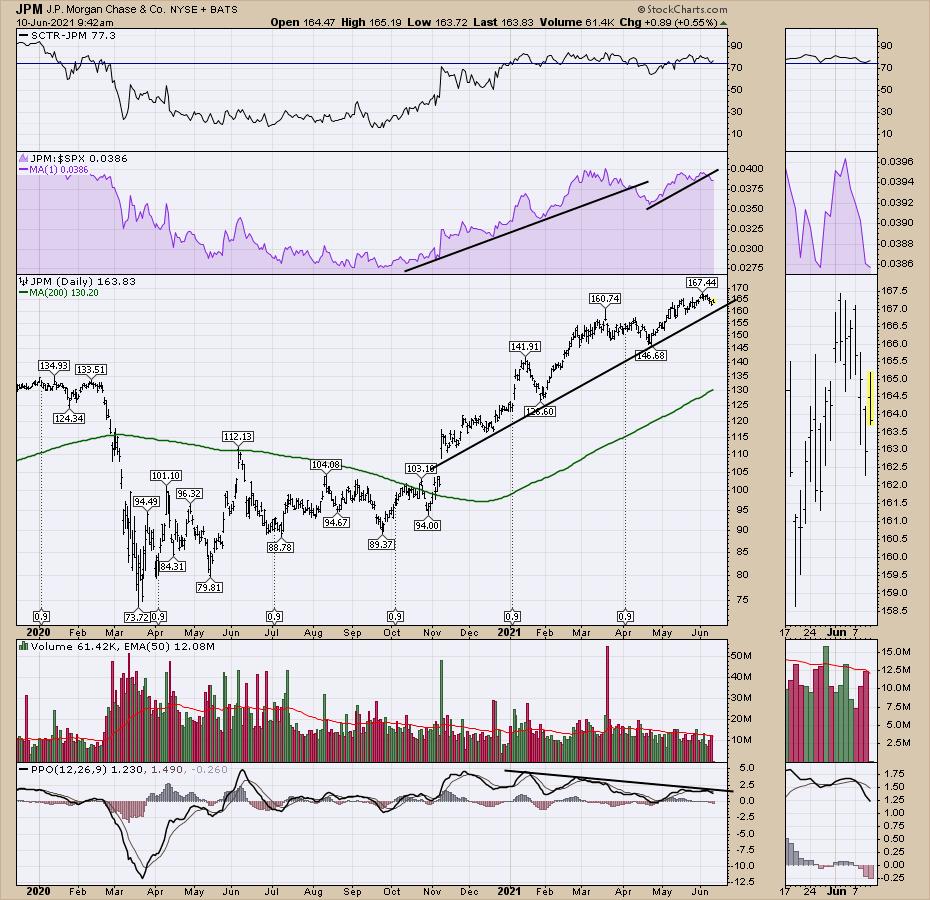
The individual bank charts don’t look as dramatic.
Here is Citigroup.
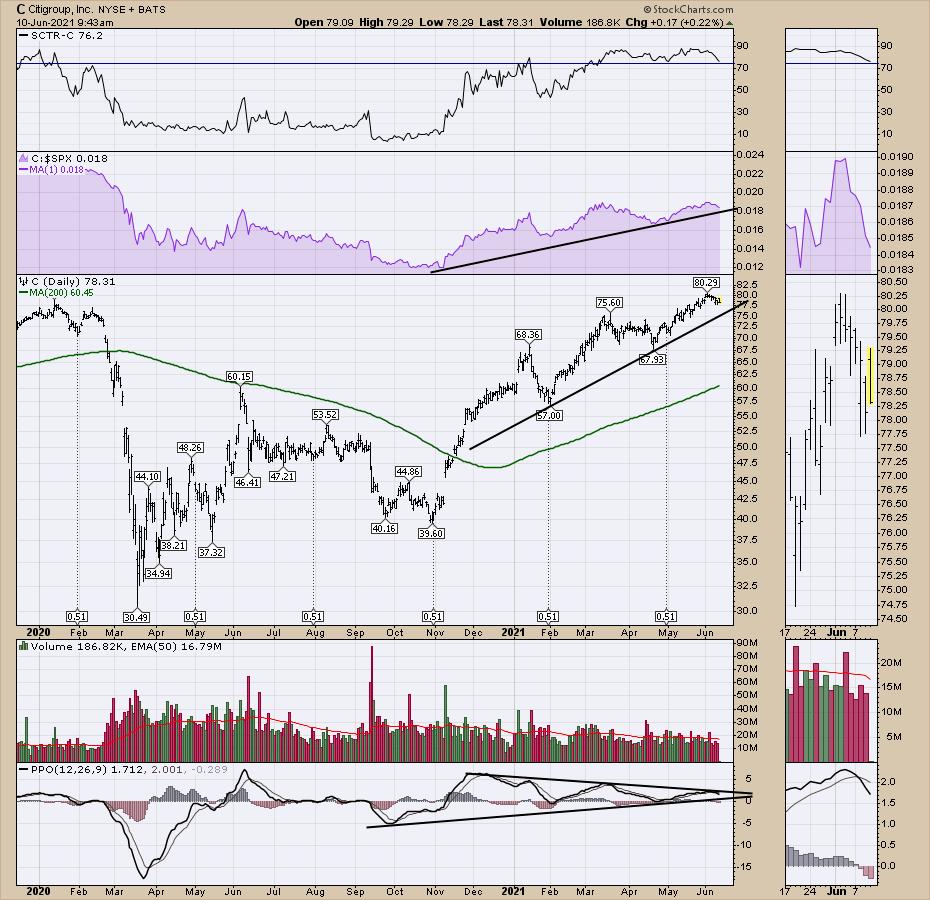
Both of the examples, C and JPM, still looks solid and have been in fantastic uptrends. With yields breaking lower, these charts might start to give up gains. For position traders, it might be a good time to have an exit in mind, but the charts are remarkably resilient so far.