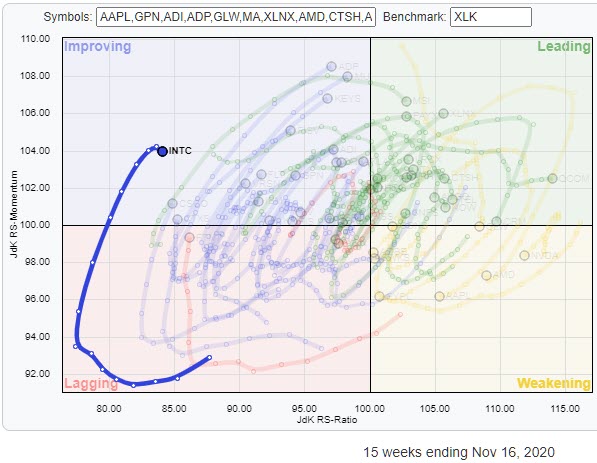
 On the Relative Rotation Graph for Technology stocks (XLK) the tail on INTC stands out. But not in a positive way.
INTC is positioned inside the improving quadrant after a recovery in relative momentum (JdK RS-Momentum) but recently started to roll over again while still being the technology stock with the lowest JdK RS-Ratio reading.
The rolling over of a tail inside the improving quadrant while very low on the RS-Ratio scale usually does not suggest much good for the stock.
When we look at the price chart that suggestion is fueled even more.
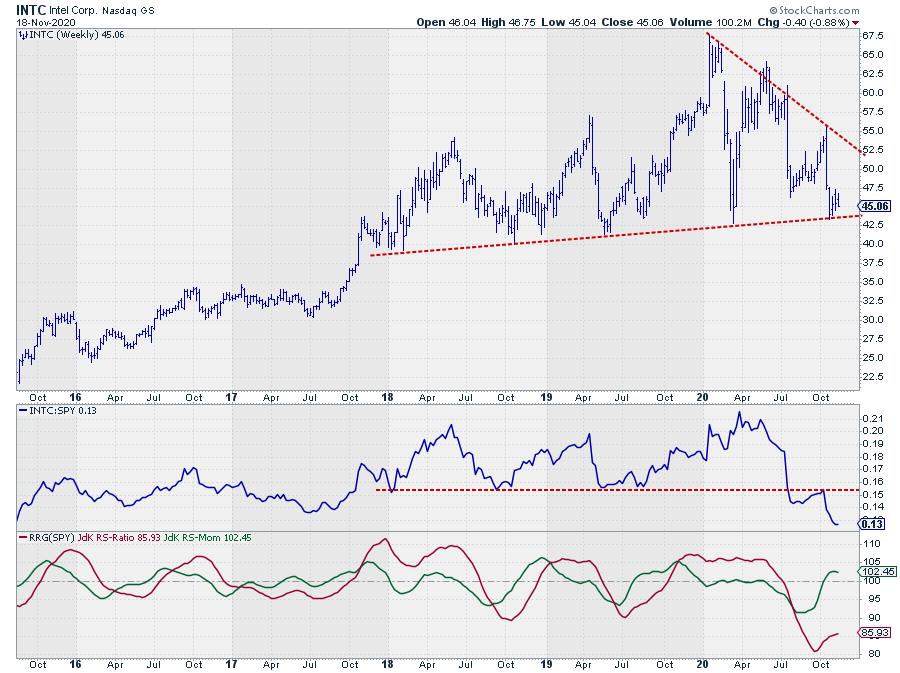
After reaching a high at the start of 2020, INTC has put two sequentially lower peaks into place which are captured by the falling resistance line coming off that early 2020 peak.
The recent decline has now bounced off a long term, slightly up-sloping, support line with multiple touch points which makes it an important level to watch. A break below that level, currently around $ 43.50 would be a very serious signal for further weakness. Breaking below such support levels usually does not go unpunished.
The RS-Line dropped below an important horizontal support level already in July and it is now falling to five year lows. The hiccup in RS-Momentum (green line) caused the tail on the RRG to push into the improving quadrant. But as you can see that move is already running out of steam and starting to roll over which will most likely lead to a return to the lagging quadrant for INTC.
When that happens, after or, in combination with a break below support on the price chart you better brace yourself as the subsequent move can be violent.
#StaySafe, –Julius
My regular blog is the RRG Charts blog. If you would like to receive a notification when a new article is published there, simply “Subscribe” with your email address.