Wanna know how to grow a small trading account? Let me tell you this…
It’s not a coincidence. It’s not luck.
It’s strategy.
Everything’s coming together nicely at once, and smart traders who understand this market volatility report crushing it …
In the current market, low-priced runners aren’t just running 20%, 30%, 50% … In some cases, like with Lighting Science Group (OTCMKTS: LSCG), they’re running 1,000% or more!
I’ve been trading like a maniac.
+$9,163 for me on $SIML $MARK $CLIS $MVIS $AAWC and $TOMZ today, best day of the year so far, absolutely incredible market environment, I hope you watched my free https://t.co/KON0UFjulH guide to capitalize on this volatility. I’ve now made $170,404 in YTD 2020 trading profits!
— Timothy Sykes (@timothysykes) May 18, 2020
Many of my top students report killing it, too … in spite of the fact that the overall market’s down.
Wanna learn from this unprecedented market? Let’s look at some of the biggest spikers in recent memory.
Remember: these penny stocks move fast. By the time you’re reading this, there’s a chance these stocks could even be done. So why bother writing this post?
A few reasons.
First, because there are ALWAYS lessons you can learn … patterns repeat over and over.
For me right now, it’s all about morning panics and first green days. If you can master key patterns, you can learn to take advantage of them when they come along again.
Second, sometimes spikers come back. Former runners are more likely to run again. It happens all the time in the market right now…
Finally, none of these tickers will be totally new to my Trading Challenge students … I CONSTANTLY post every single trade and market commentary in my chat room and on Profit.ly. So if you’re part of the Challenge, you get this kind of information in your inbox and via chat all day.
How to Grow a Small Trading Account in this Crazy Market

If you expect stocks to perform like they would in a normal bull market, you’ll be disappointed BIG TIME.
It’s all about adapting.
My top students understand this. This is how they report profiting right now — like Jack Kellogg, my latest six-figure student who reports profits of $70K last month.
(*Please note: Jack’s results are not typical. He’s spent years developing exceptional skills and knowledge. Always remember trading is risky. Never risk more than you can afford.)
Understand the Market
There’s no excuse to not understand what’s going on in the market right now. I just released a FREE two-hour video lesson, “The Volatility Survival Guide.” In this comprehensive guide, I explain the basics of this market … and any volatile market.
Learn how to adjust your approach — get this no-cost guide now.
There are also SO many amazing tools at your disposal right now, like StocksToTrade’s new Breaking News chat feature or social media tool…
Guys, calling out pumps like $KTOV $GNUS $DFFN $SPOM is not saying I’ll never trade it, I buy pumps daily. I just know what they are vs naive newbies who believe in the hype & i cannot encourage you enough to use the @StocksToTrade social media search tool to see all the pumping!
— Timothy Sykes (@timothysykes) May 18, 2020
Examples of Stocks in Motion RIGHT NOW
Looking for evidence that penny stocks can grow your account fast? Look no further. These are just a few of the MANY insane spikers right now…
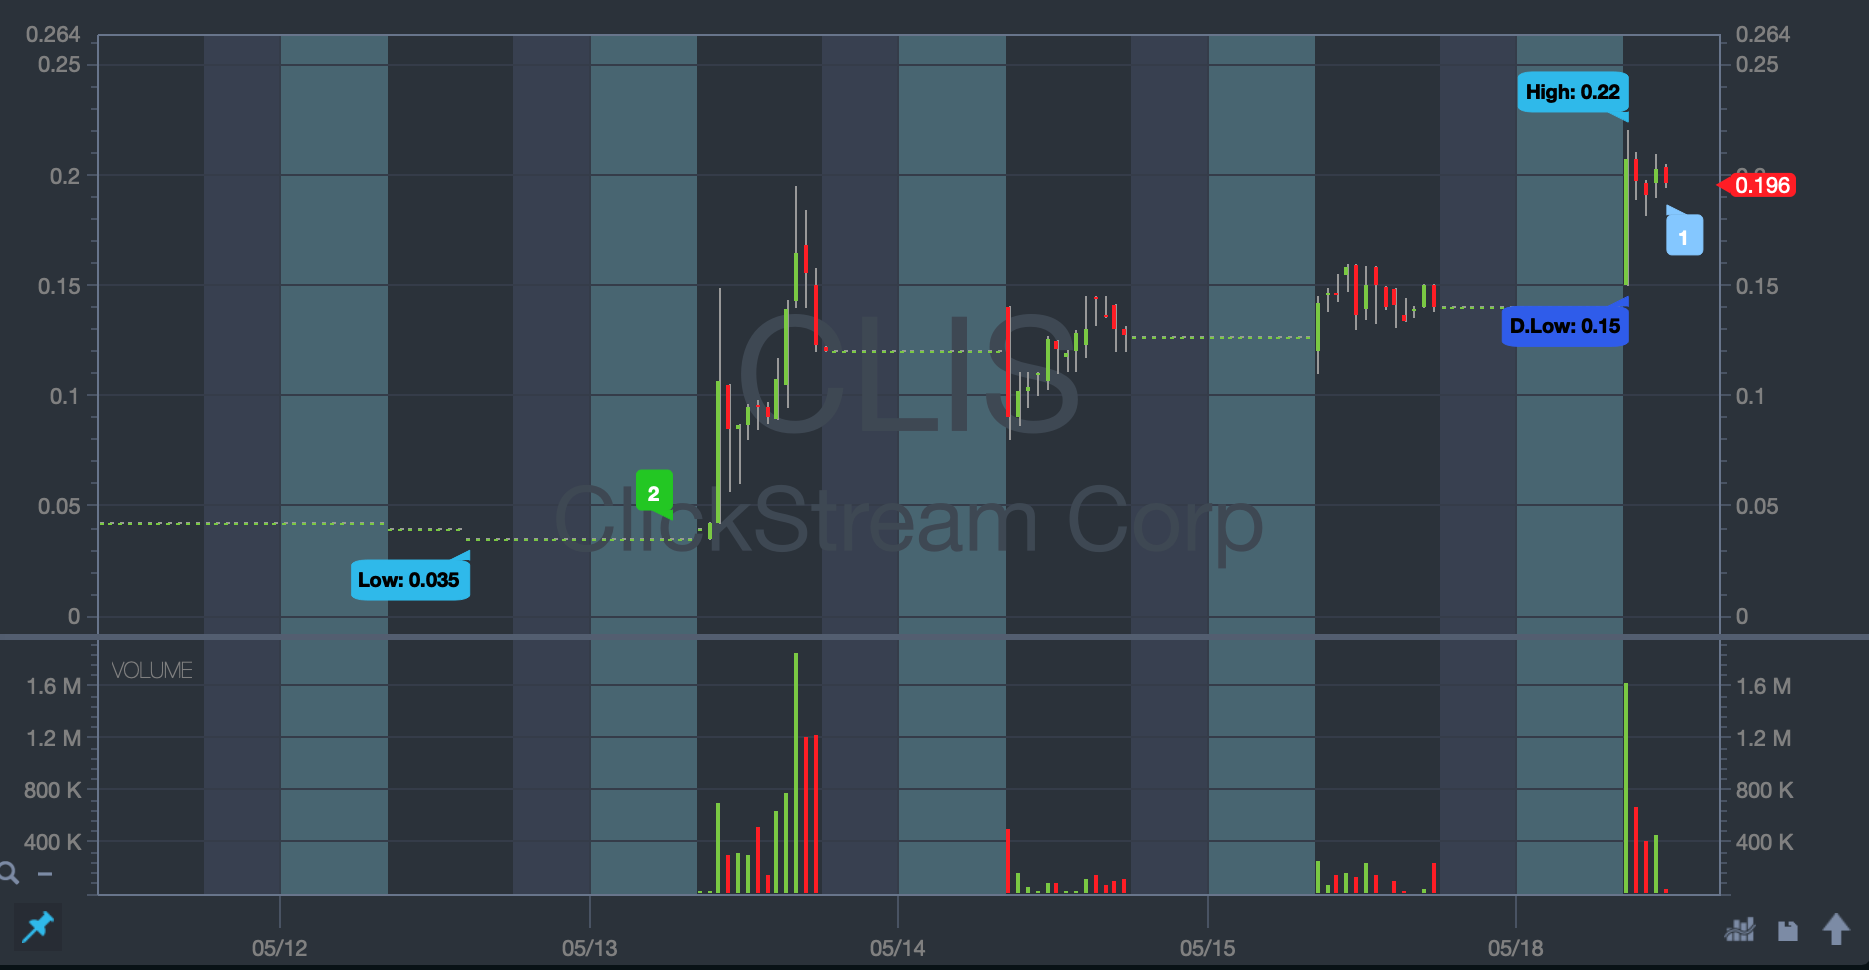
Clickstream Corp (OTCMKTS: CLIS)
This stock has gone CRAZY. Last week, it had a news announcement that it signed a deal with former NFL star Brian Baldinger to host a program on the company’s app and platform…
The stock went insane, climbing from 4 cents to 20 cents … Five times your money in one day.
It hasn’t stopped. As of this writing, it’s up to 27 cents.
I killed it with CLIS, making $846, $630, and $750 profits.**
Profit.ly user Luke_Fenwick reports trading CLIS too … with a small account.
You can trade with a small account. By starting small and scaling up over time, you can learn to master the patterns. That’s a smart way to work toward consistency.
Check out the CLIS chart:
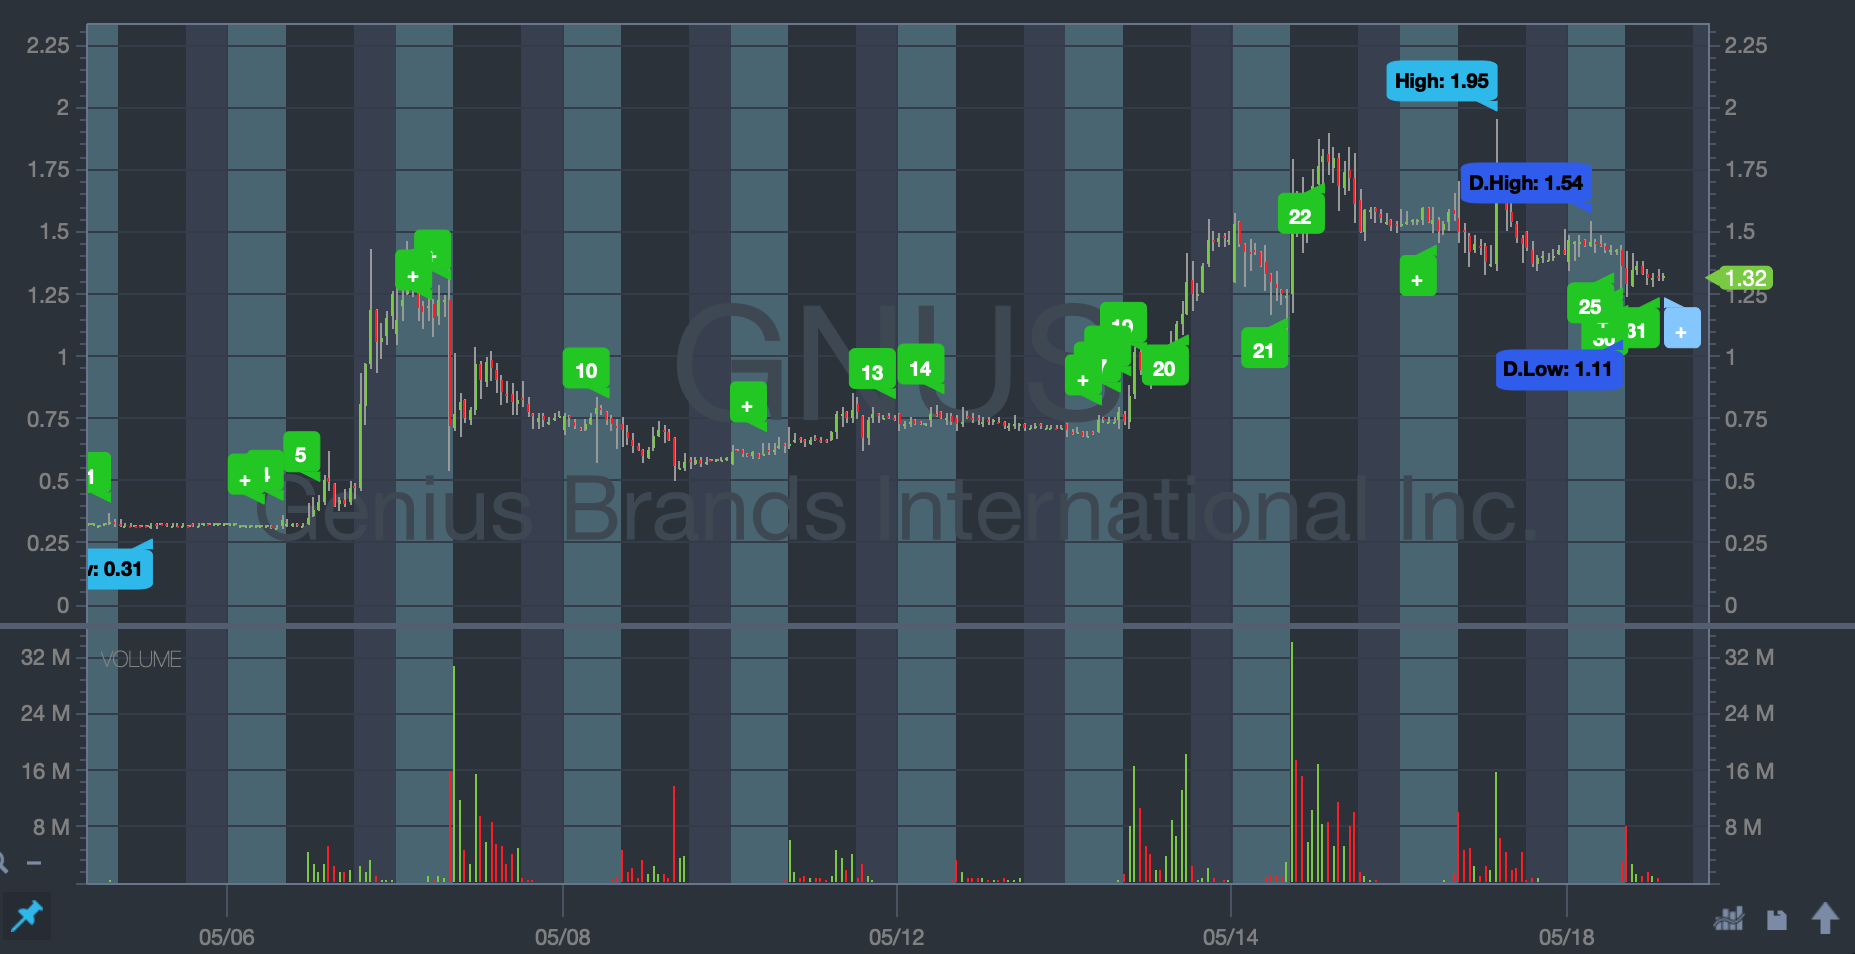
Genius Brands International Inc. (NASDAQ: GNUS)
Here’s a play that made me over $5K over the course of a few trades.
Here, you had a stock that was up based on a real catalyst — a shareholder letter. I found that out thanks to the new Breaking News tool on StocksToTrade…
Once I realized the catalyst was real, I initially bought in the $0.70s. I sold way too soon in the $0.80s before it nearly doubled … Even so, I made almost $2K.**
The next day I went back for more, dip buying and netting a $3K+ profit.**
Not long after, it hit new 52-week highs … Check out the chart:
(**Results are not typical. I’ve developed exceptional knowledge and skills over time. Most traders lose money and trading is risky. Do your due diligence and never risk more than you can afford.)
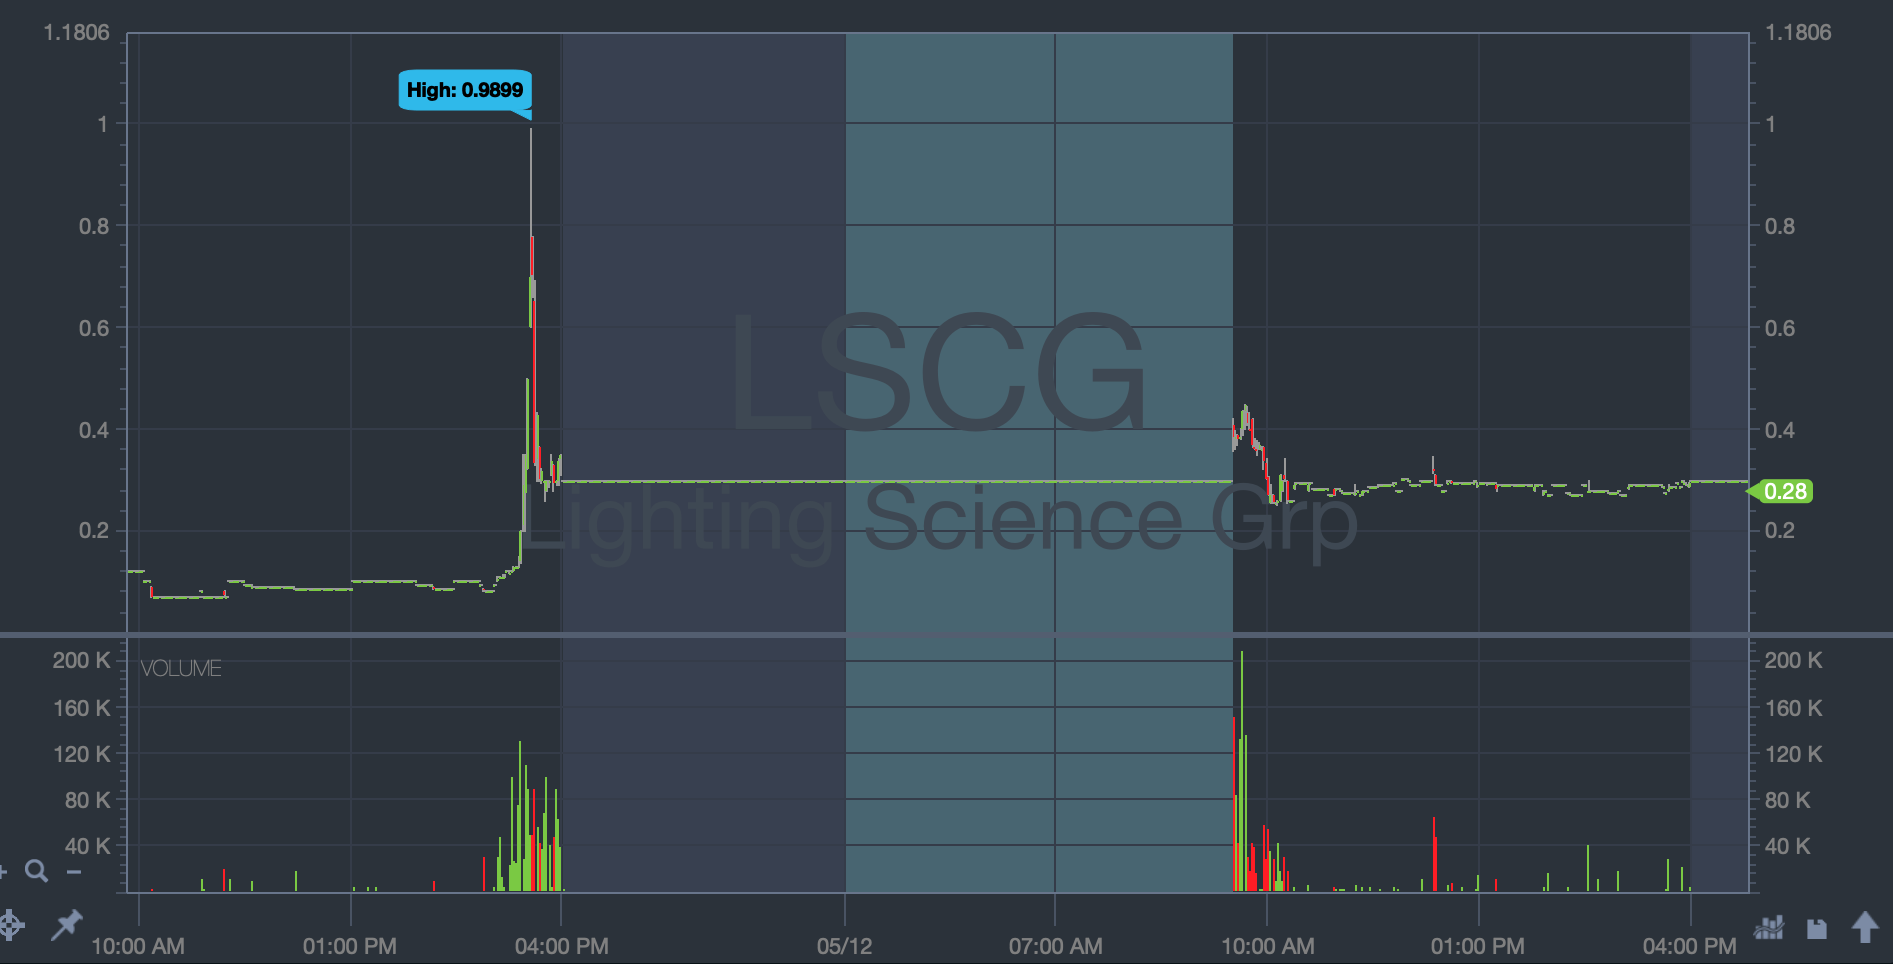
Lighting Science Group Common Stock (OTCMKTS: LSCG)
After LSCG was featured on Fox News a few days ago about a new method of UV light cleaning, the stock went up from about 8 cents to about a dollar — in about an hour.
You just don’t see large-cap stocks like Google do that.
The spike was VERY short-lived, but this just goes to show how fast things can move in the penny stock world … It’s also a good lesson in why you need to be prepared for spikes like this.
Check out the chart to see the crazy action:
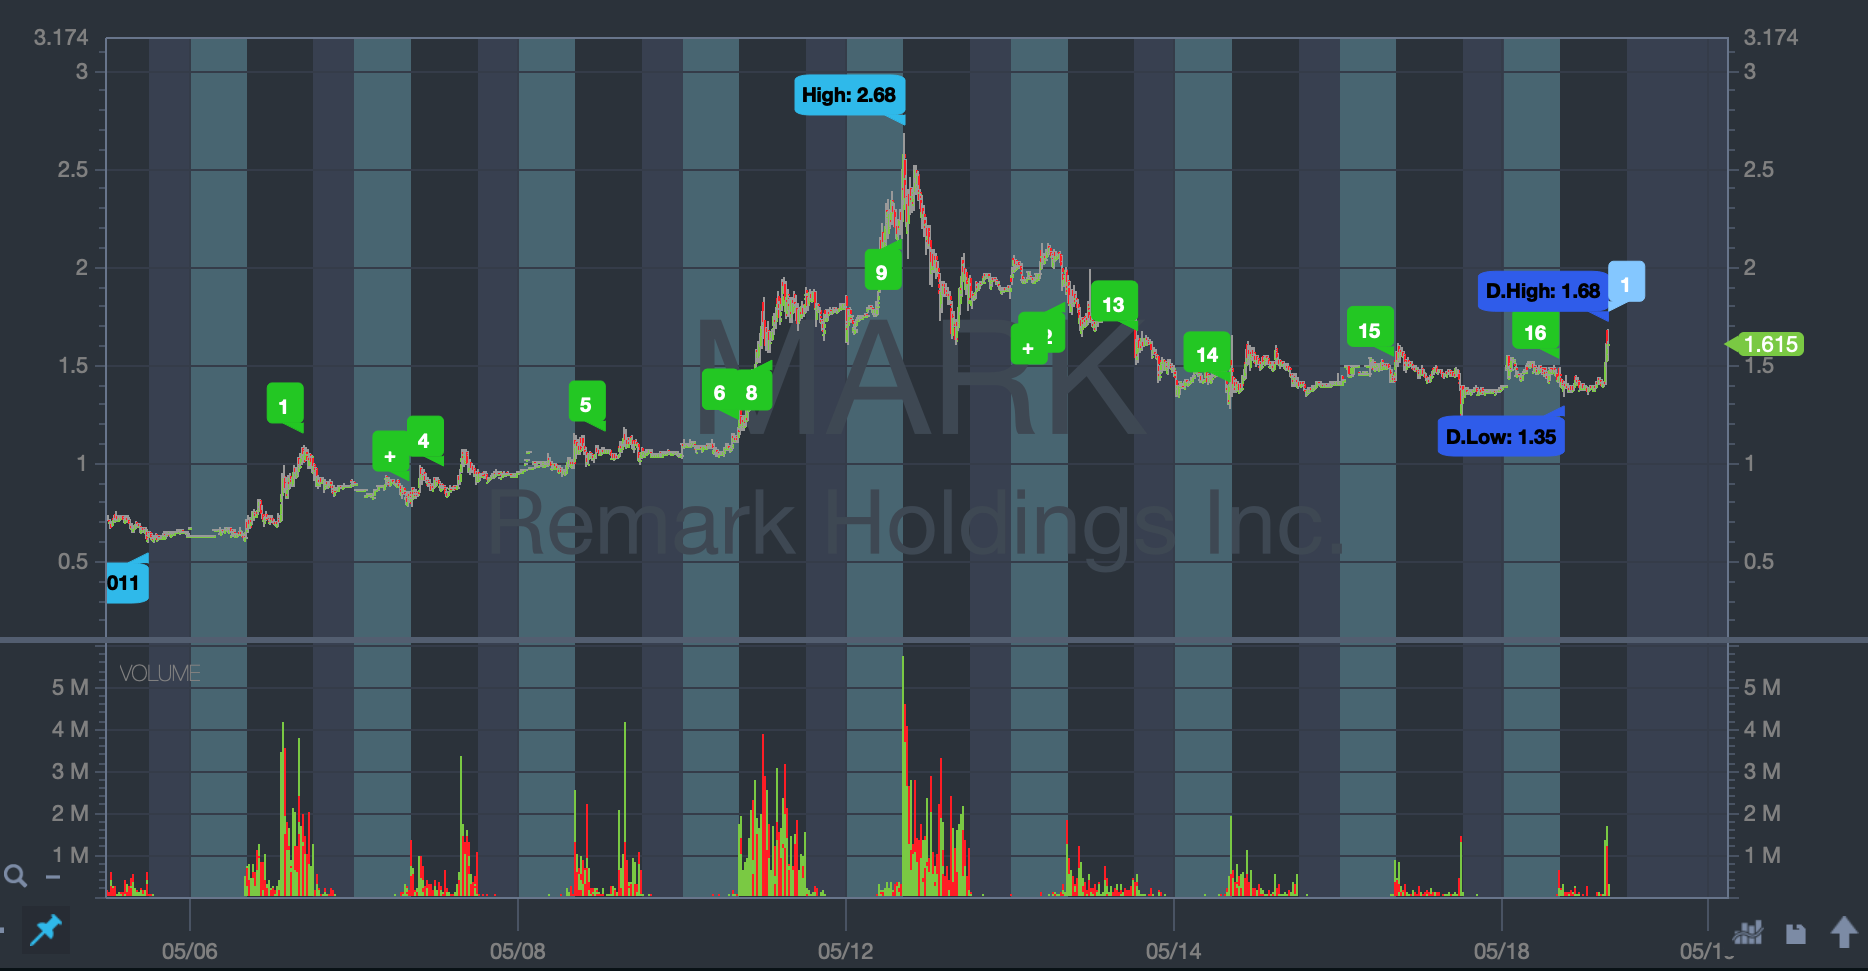
Remark Holdings Inc (NASDAQ: MARK)
This stock was up on a potential contract … But when a stock like this starts going up many times over and the contract still hasn’t been announced, it’s cause for concern.
I bought in the $0.30s and $0.40s … But I didn’t get greedy. In fact, I got out too soon … It went as high as $2.68 before it started to fail.

Pumpers and short squeezes are some of the biggest things driving up stock prices right now … You need to know that. I usually find them through the STT social media tool … These pumps all come in at the same time.
My students killed it on this one, too…
Profit.ly user Mattrick04 reports trading this stock:
“Thought this was way overextended, and decided to short 1k shares premarket when it was at 2.04. Then I was able to short another 500 at 1.74, which brought my avg down to 1.94. This continued its downtrend and hit my sell in after hours.”
Check out the insane movement over the past week and a half or so:
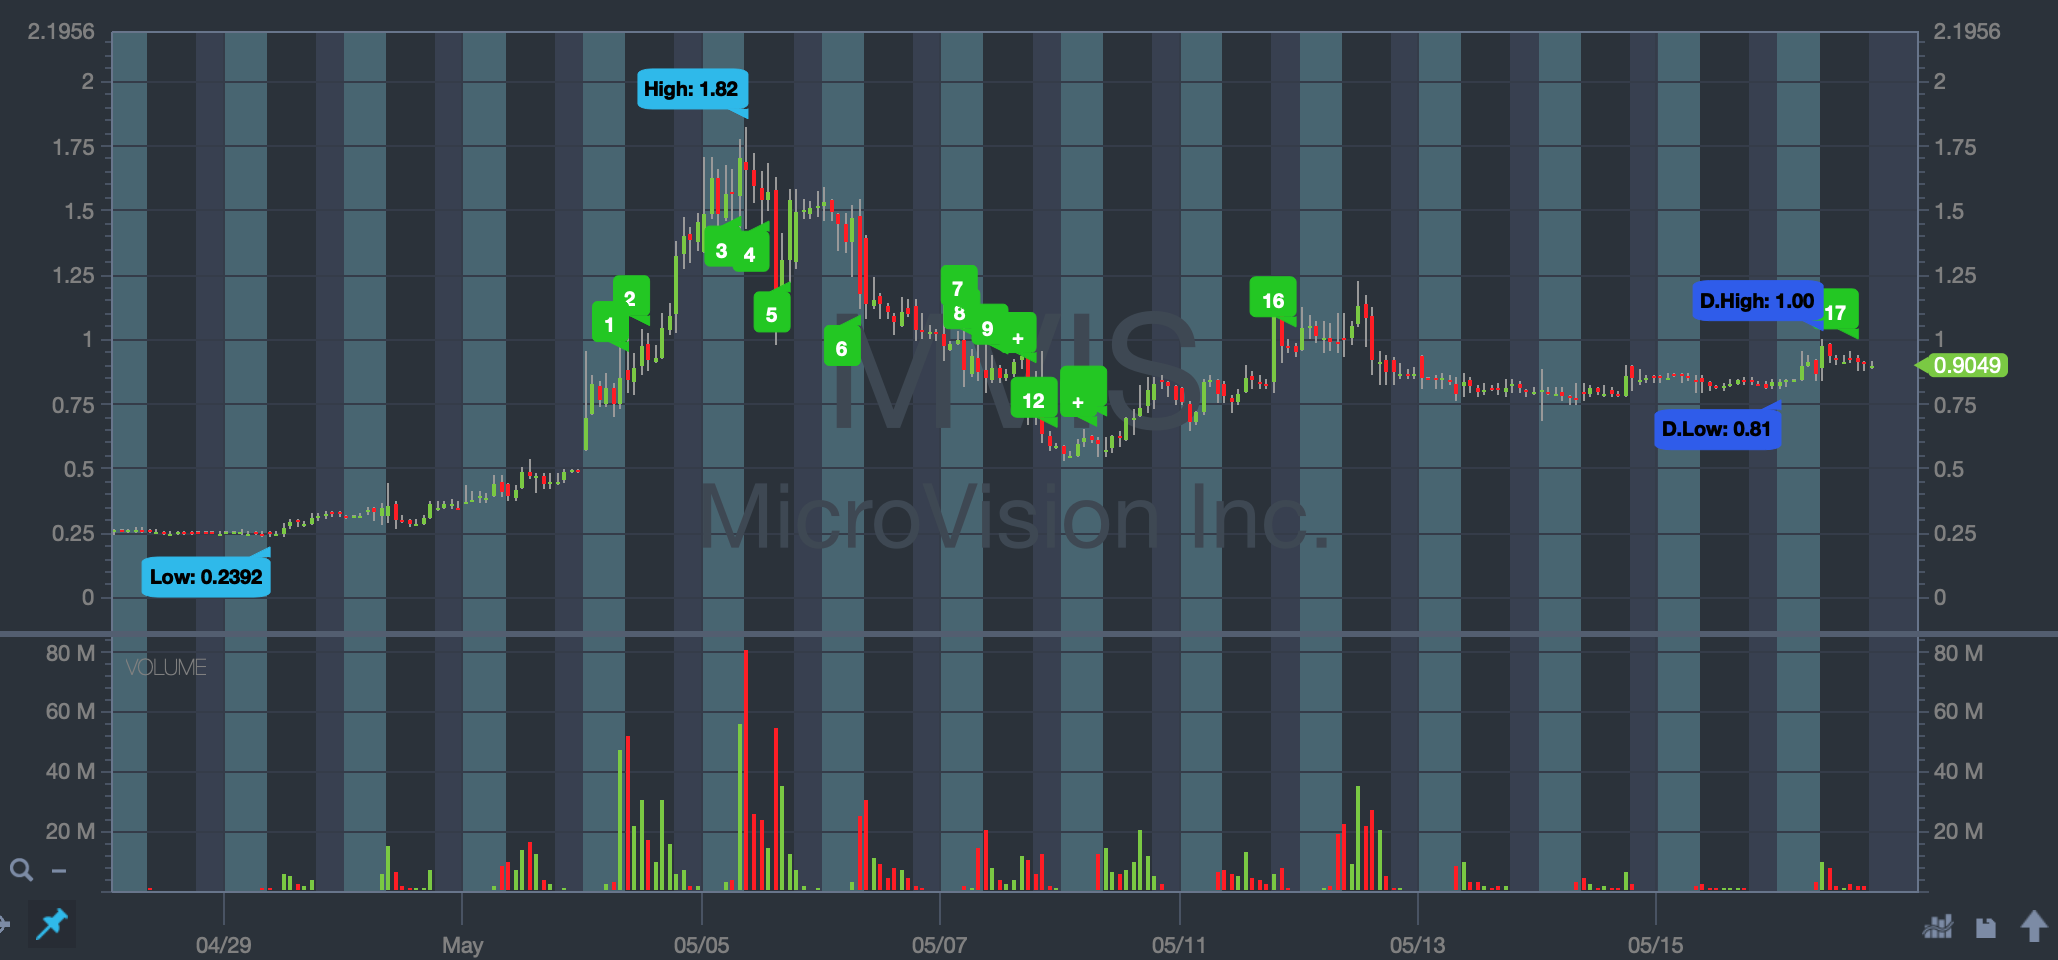
MicroVision Inc. (NASDAQ: MVIS)
At the end of April going into May, this stock was trading for about 25 cents … Then in early May, it spiked all the way up to $1.82.
I love catching recent runners. So when the STT Breaking News tool alerted that there was a video released that hinted at a relationship with Microsoft, I thought a spike could come fast.
But just because I buy or short a stock based on a pattern/indicator I use does NOT mean it’s not a pump anymore…seriously, use the damn @StocksToTrade social media search tool & see how your favorite tickers are being pumped, newbies usually thank me for opening their eyes!
— Timothy Sykes (@timothysykes) May 18, 2020
I ended up making a nice little $1,875 profit on MVIS thanks to getting this news early!**
Here’s a 15-day chart. You can see how this stock went from snoozing at the beginning of the month through two key spikes and many small ones in between…
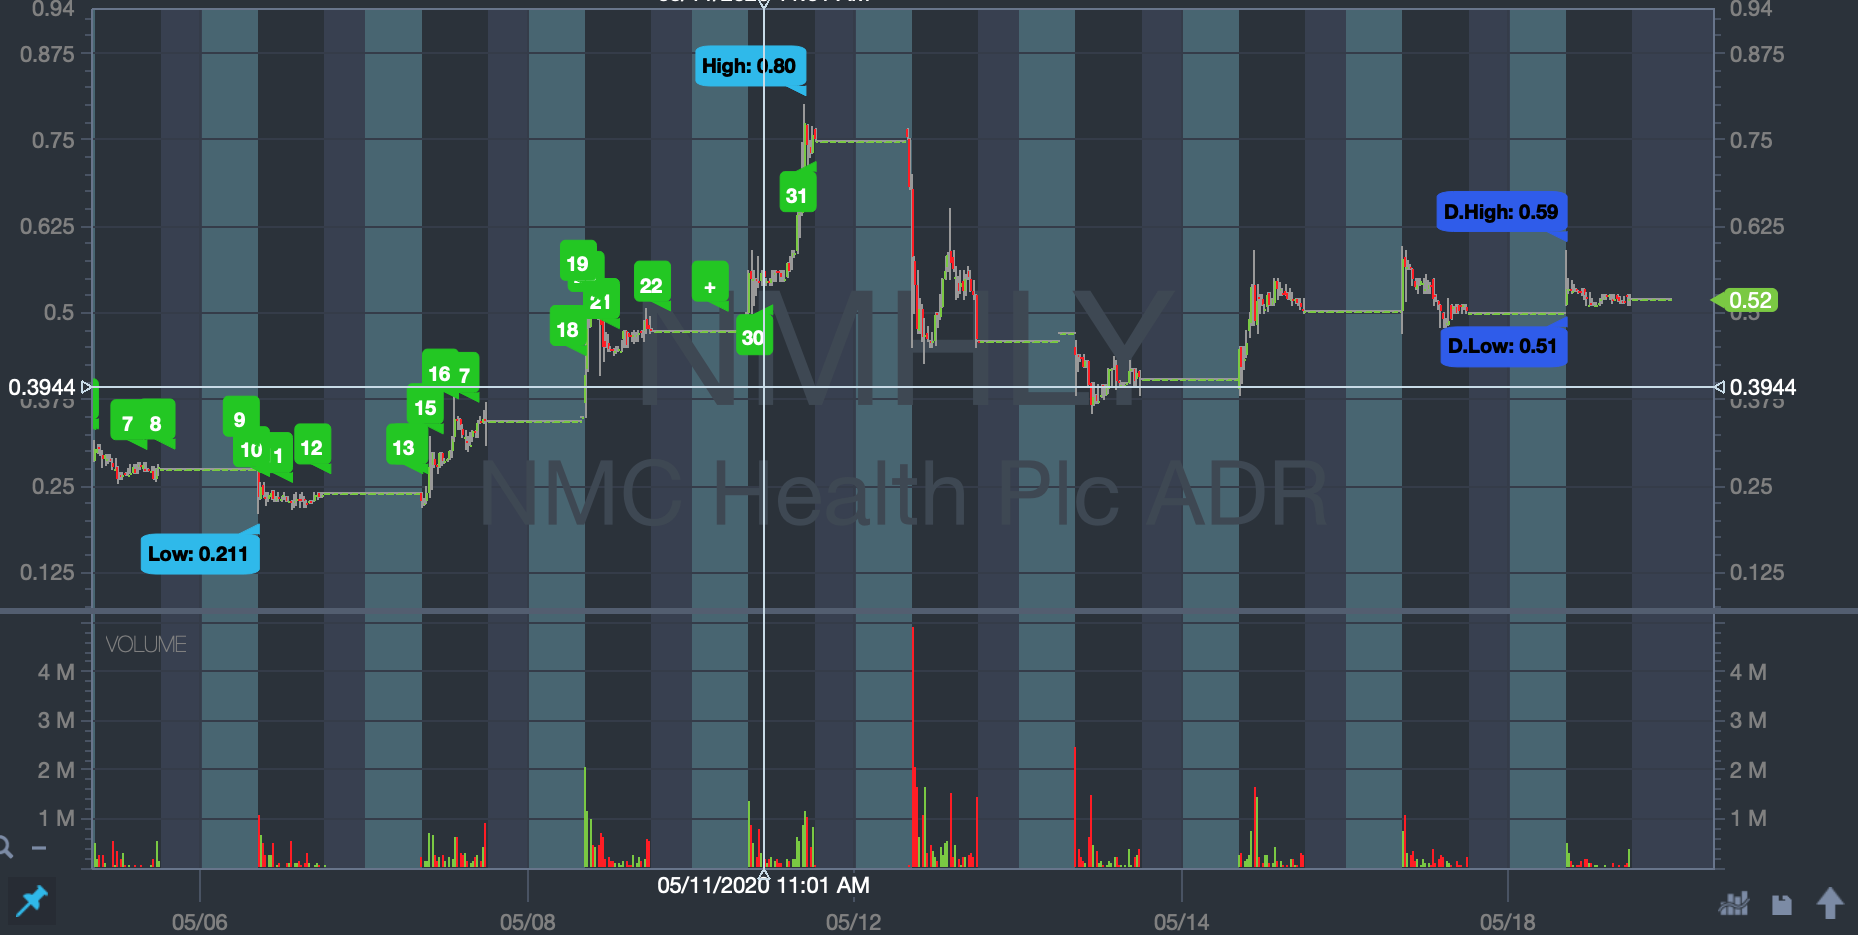
NMC Health Plc ADR (OTCPK: NMHLY)
Students like Kyle Williams and Jack Kellogg were wise to this ticker during its first big spike earlier this month. That’s when it went from about 20 cents to 80 cents in a matter of days…
Then I saw a chance to dip buy this morning spiker when it cracked off its highs. I got out fast because I didn’t want to get greedy and took roughly 10% gains … Even so, I made a quick $1,125 profit before lunch.** It’s SO hard to avoid overtrading with all these amazing plays!
Check out these beautiful spikes:
(**Results are not typical. I’ve developed exceptional knowledge and skills over time. Most traders lose money. All trading is risky. Never risk more than you can afford.)
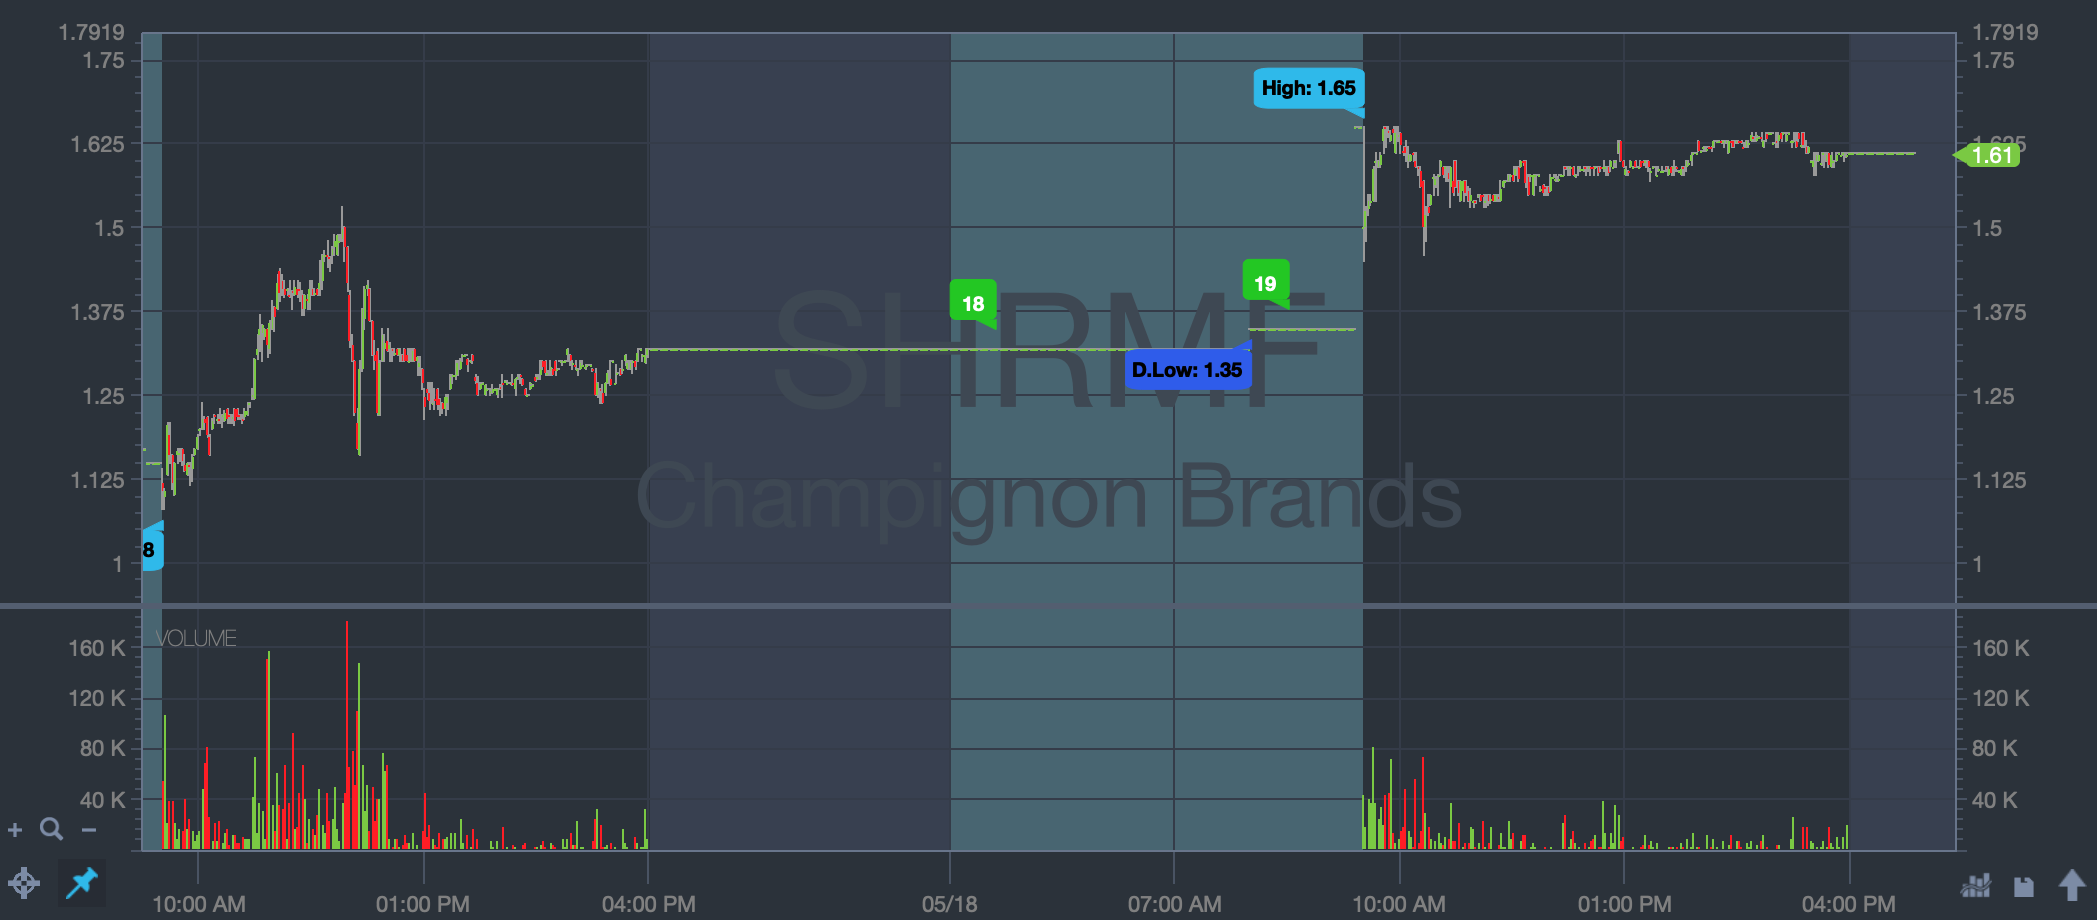
Champignon Brands (OTCQB: SHRMF)
About a week ago, this ticker was trading for about 70 cents, and it spiked all the way to the $1.50s. I missed that first dip and bounce. But when I saw my chance I dip bought, hoping to sell in the $1.30s or $1.40s…
I tried to give it time for more of a bounce, but the first panic was the better dip buy. So I got out midday for a tidy little $504 profit** … Not too bad, but there were just so many plays that I wanted to move on!
Check out the action:
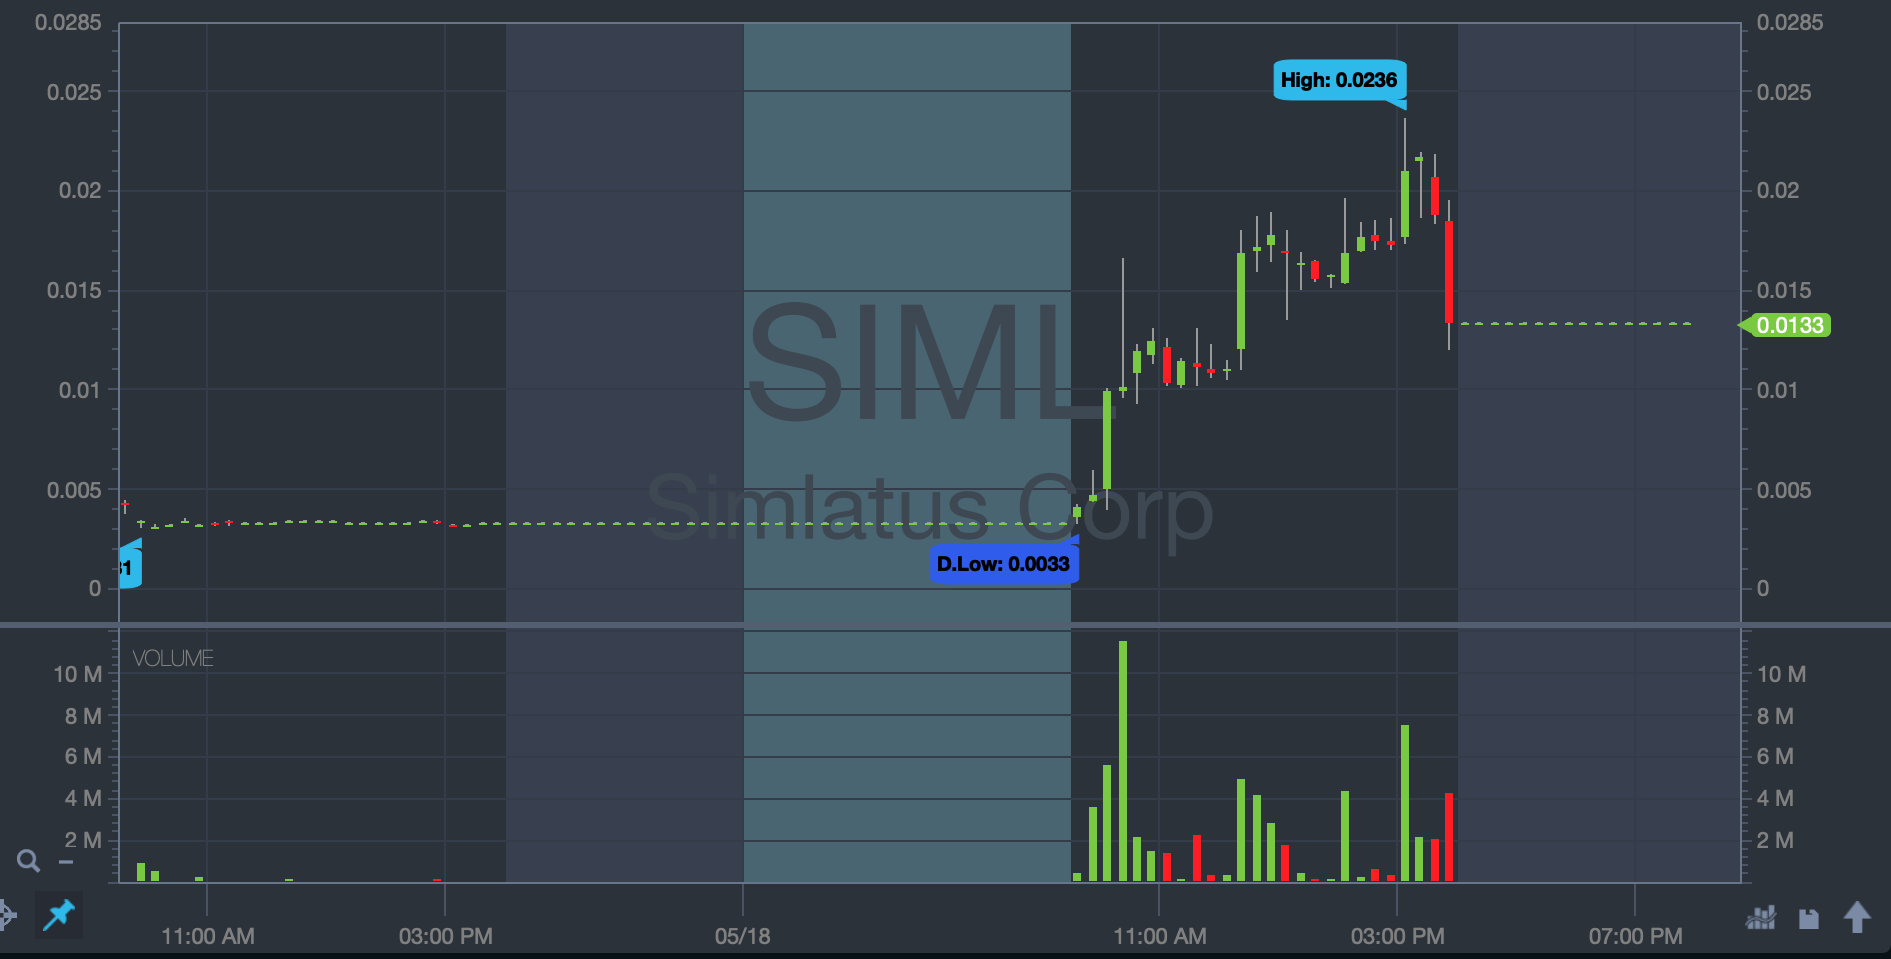
Simlatus Corp. (OTCPK: SIML)
I normally stay away from sub-penny plays. But the fact that so many low-priced runners have been exploding lately — plus the fact that it was breaking new day highs — drew me in.
I bought at $0.009 and sold at $0.013 for a quick $1,100 profit.** It was a solid winner, but I didn’t want to get greedy … I focus on locking in singles during an insane $10K+ trading day!**
I couldn’t resist one more play going into the end of the trading day on May 18 … It just kept going. I only got partial execution and didn’t hold overnight — that can be risky in this market environment. But I still made one last $294 profit for the day.**
The two-day chart shows how crazy this stock got and how fast it happened:
(**Results are not typical. I’ve developed exceptional knowledge and skills over time. Most traders lose money and trading is risky. Do your due diligence and never risk more than you can afford.)
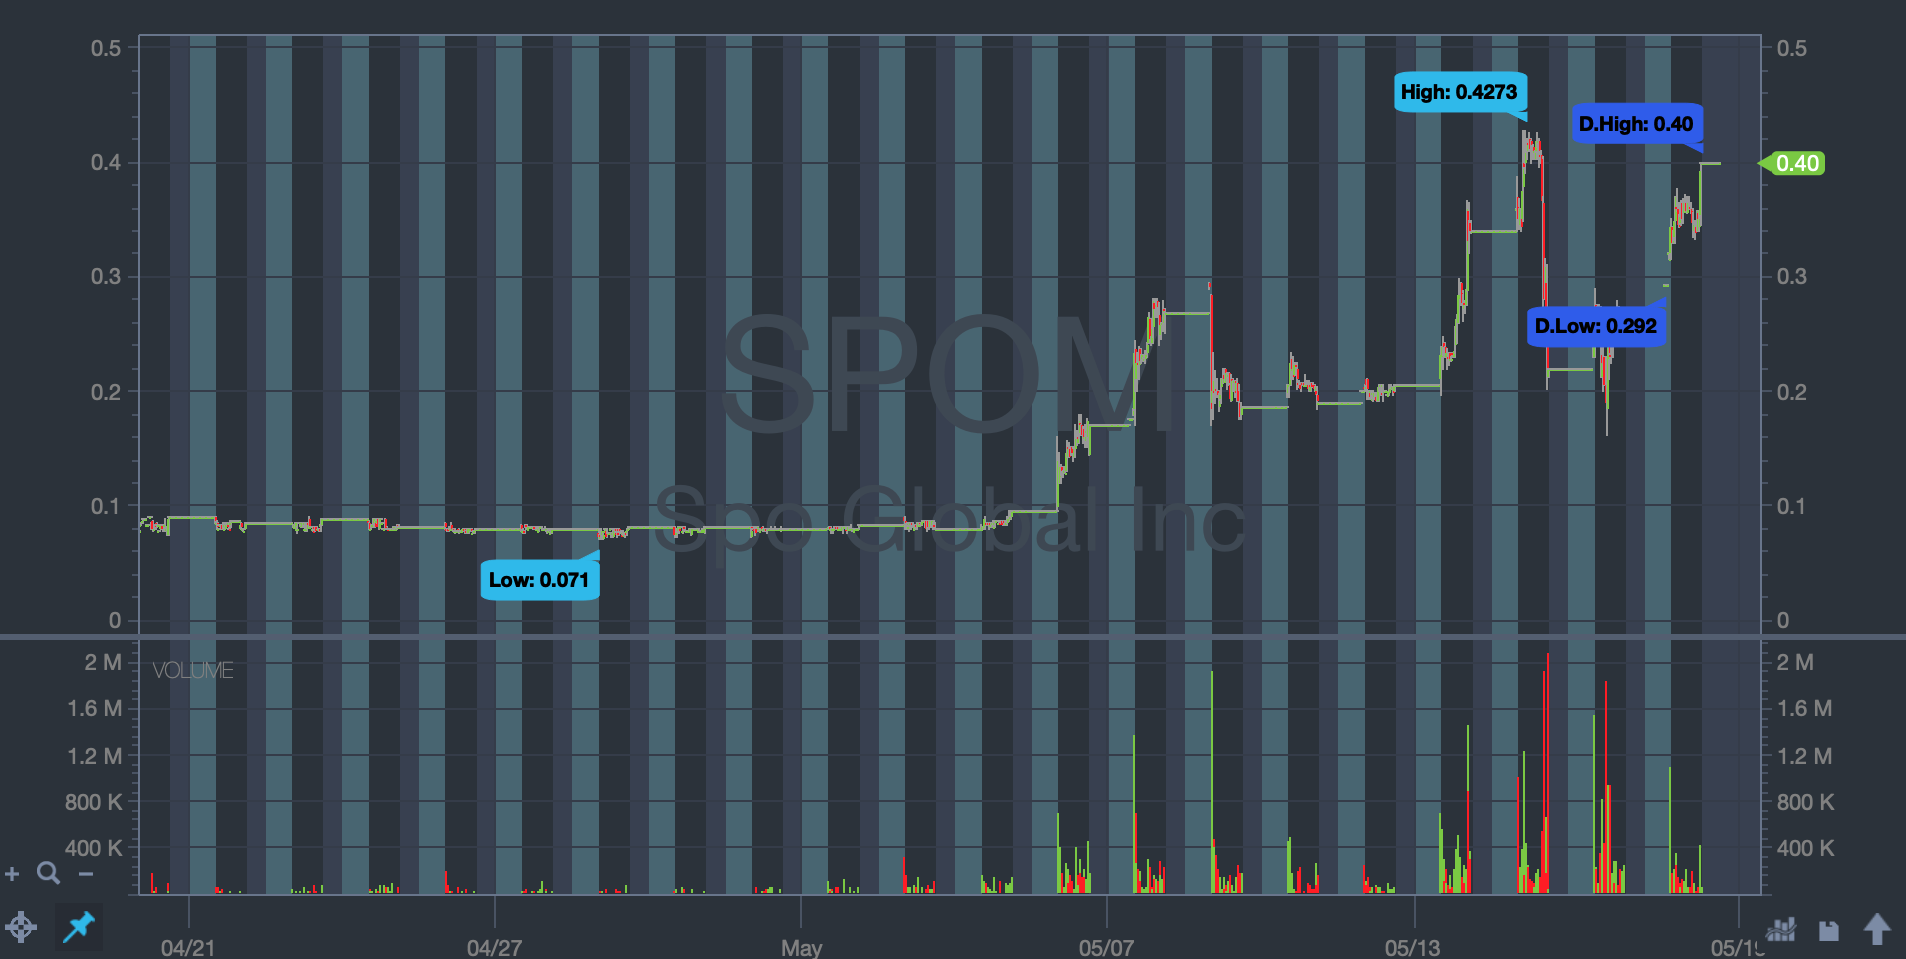
SPO Global Inc. (OTCMKTS: SPOM)
At the beginning of May, this stock was nothing. Then on May 5, it started running. The company announced a merger with a Chinese healthcare group in February … Right now, even a whiff of a connection to coronavirus can move stocks, even with a delayed reaction.
It went from about 8 cents to 17 cents in a day … Then it went to about 30 cents the next day.
Check out its performance from April to May:
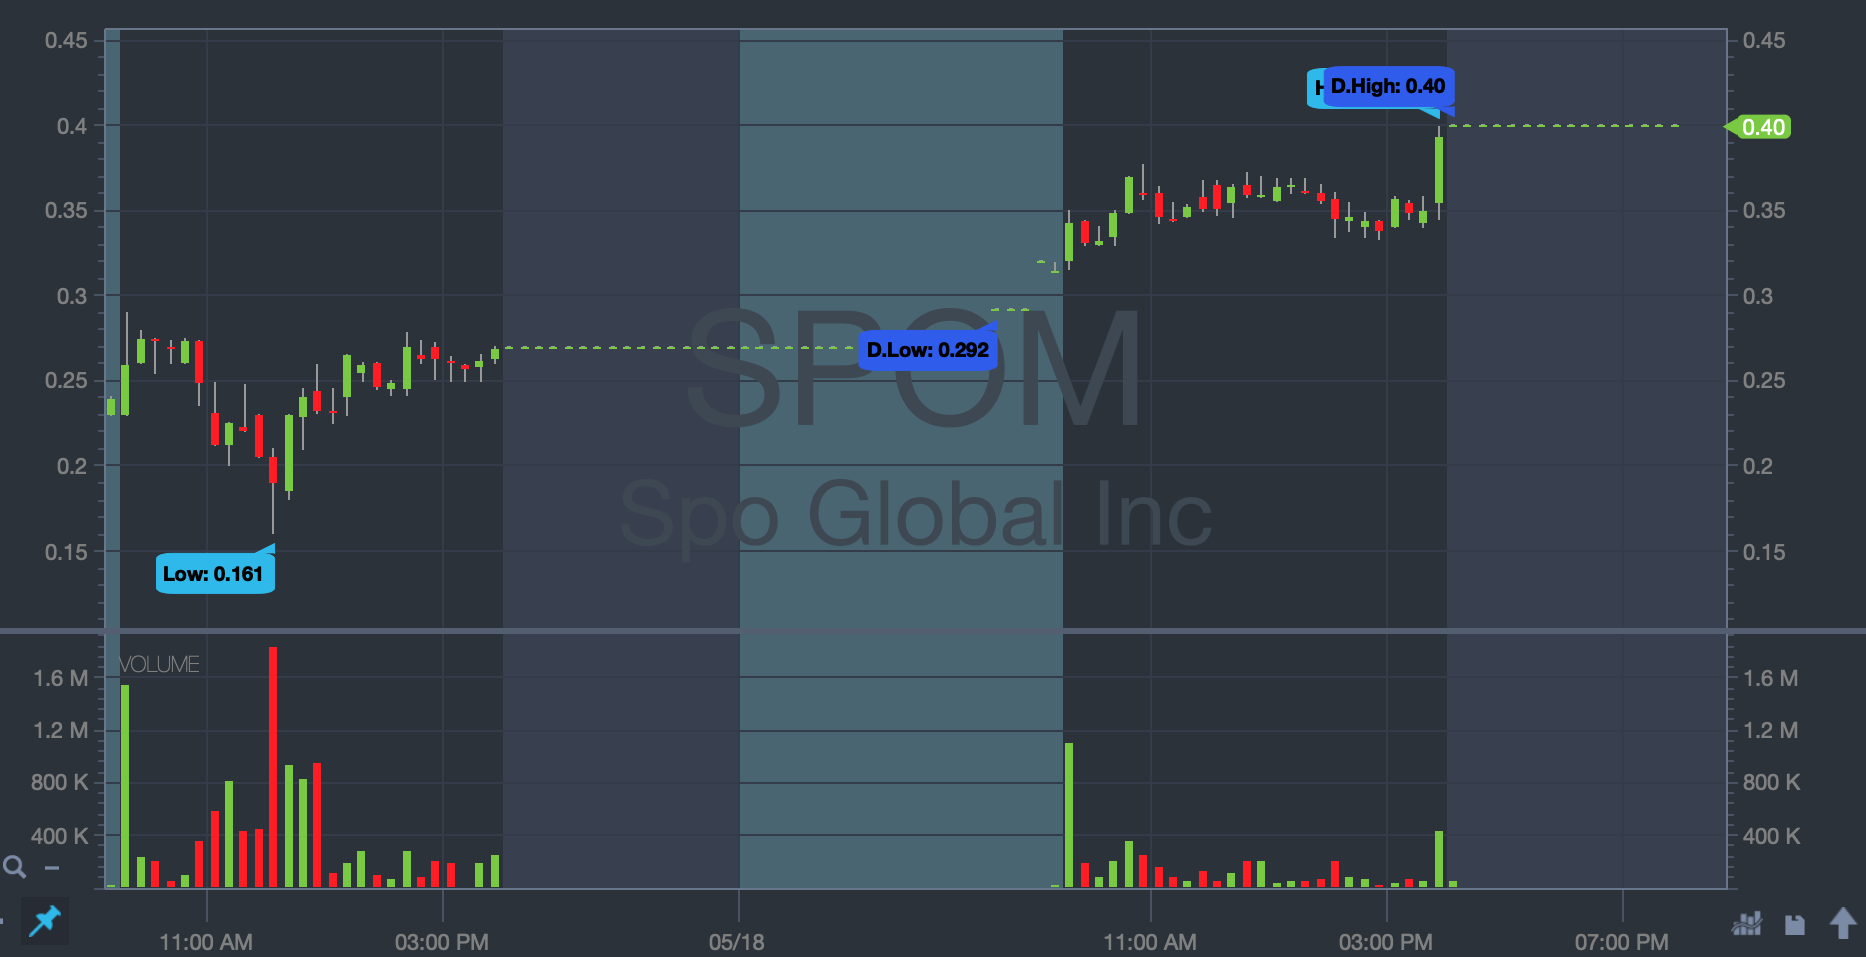
I bought this as a breakout, and when I saw it started running again on May 18, I got in for a single … Even though I actually thought GNUS was a better play on that day, I still had two successful trades with $316 and $1,588 profits.**
Here’s a close-up of the most recent action:
(**Results are not typical. I’ve developed exceptional knowledge and skills over time. Most traders lose money and trading is risky. Do your due diligence and never risk more than you can afford.)
Touchpoint Group Holdings Inc (OTCQB: TGHI)
Touchpoint is a digital media and tech company. In early April, it announced a deal with hip-hop mogul Russell Simmons to stream his yoga classes. The stock spiked but didn’t hold its gains.
Then this SEC filing on April 30 made TGHI a big percent gainer on May 1. The filing announced a licensing agreement with Royal Personal Training. As so often happens with low-priced stocks, there was informational inefficiency. The market took an entire day to react.
Take a look at the TGHI three-month chart:
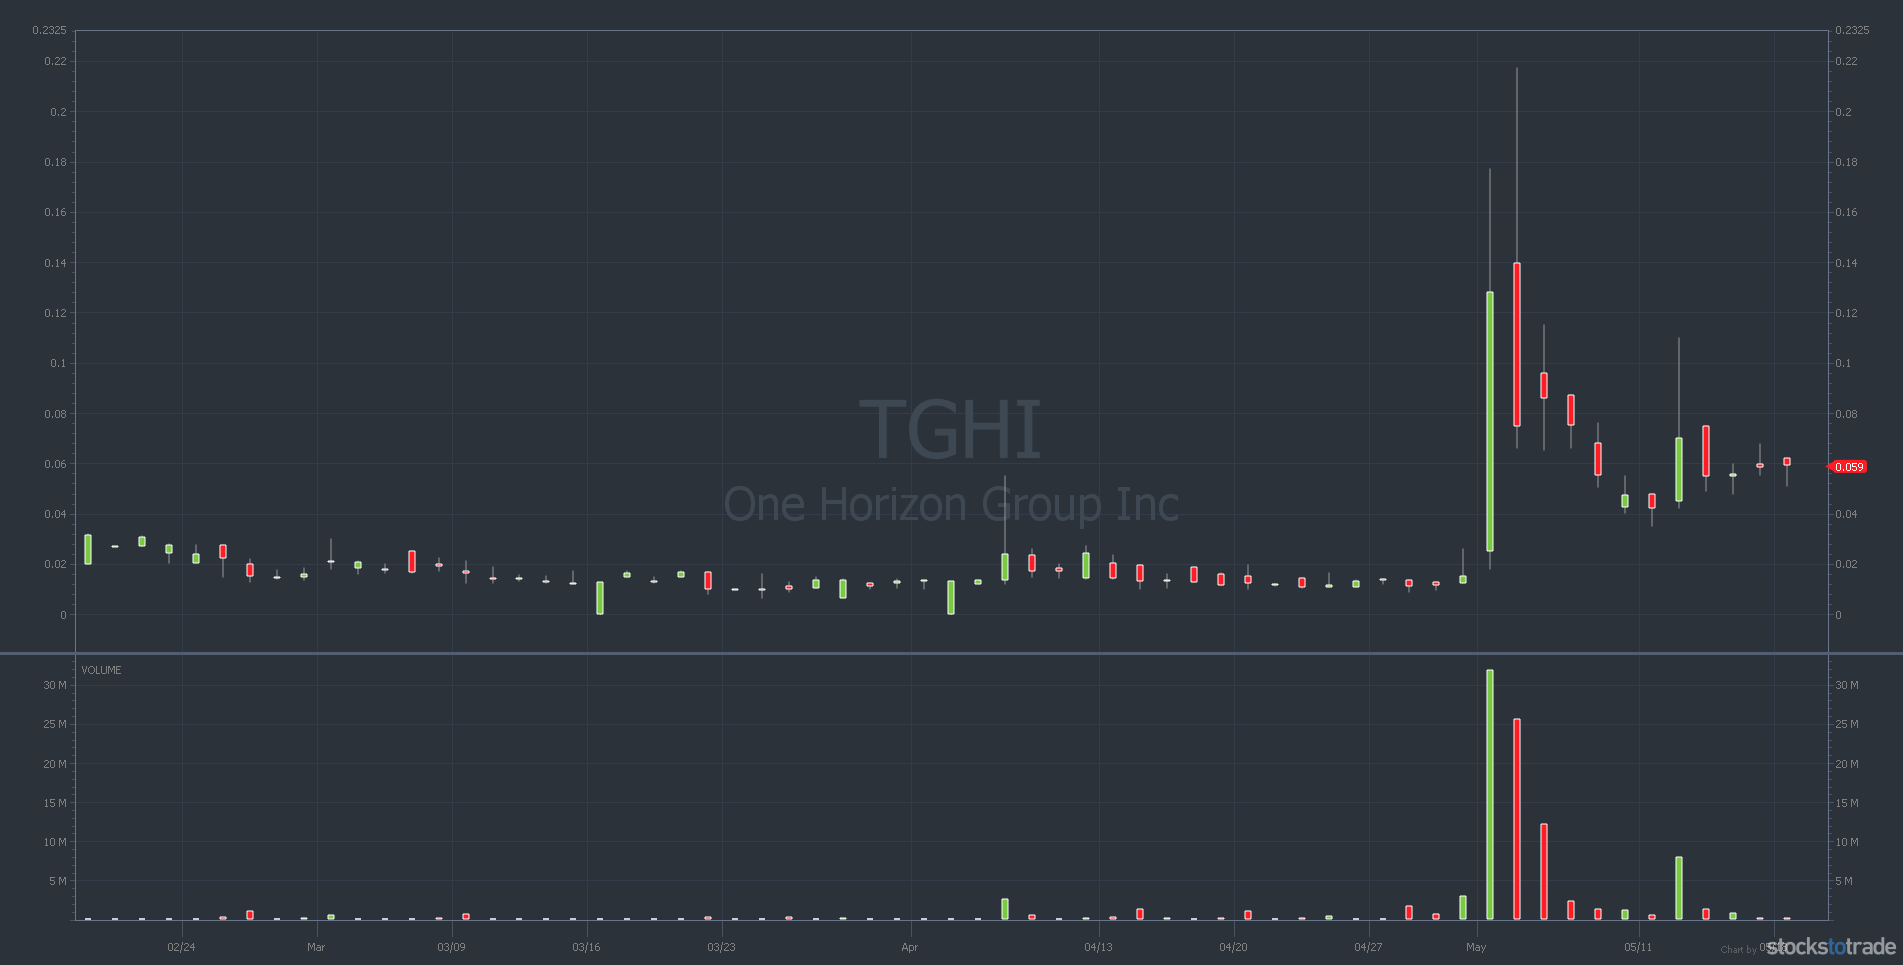
As you can see, TGHI went from one cent up to 18 cents on May 1. It finished at roughly 12 cents per share. The next day, it went all the way up to 21 cents.
Check out the TGHI 12-day chart:
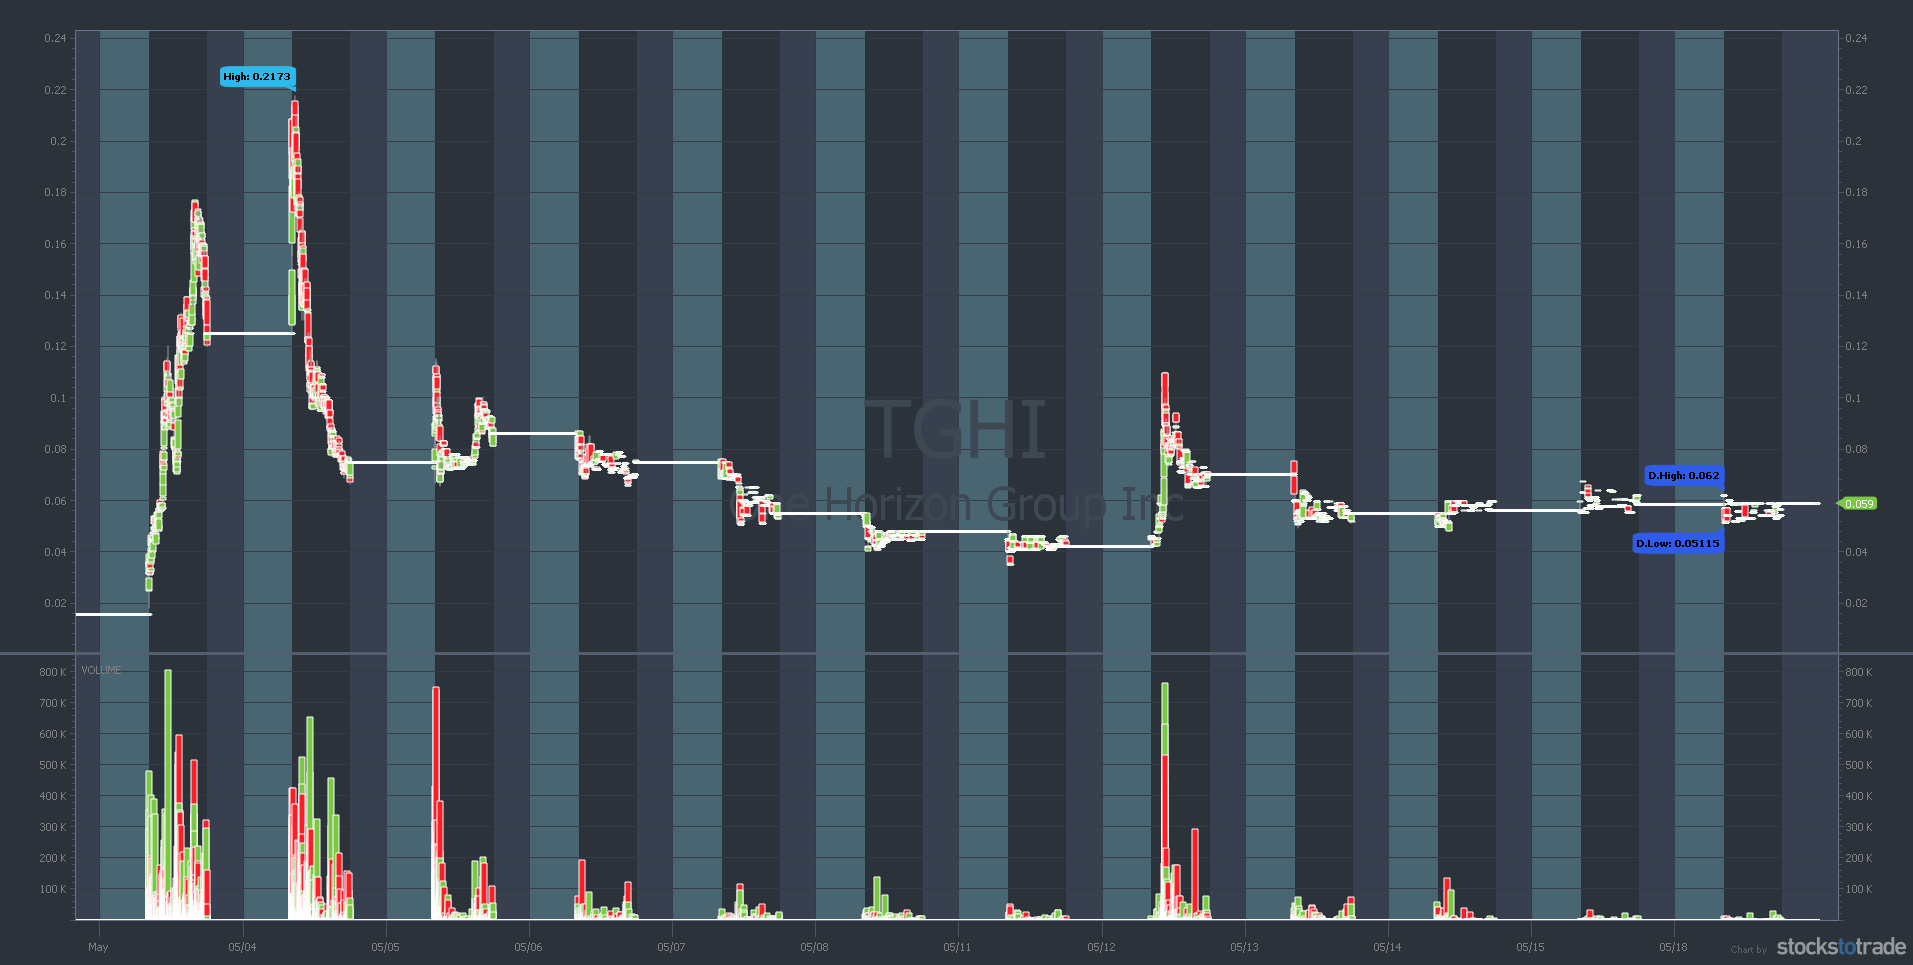
I banked on TGHI, riding it up a few times and then playing the wannabe comeback on May 12. My total profits on this stock are $11,120.**
And it wasn’t just me…
On May 12, Profit.ly user WinterSoldier reports trading TGHI. And ThePennySqueeze reports trading it too.**

Remember, it’s not just about big wins. It’s about how you trade. When you’re learning how to grow a small trading account, take it one trade at a time. Profit.ly user joshmagder reports this trade and commented…
“First day of trading with 25K to avoid PDT… obviously WAY overtraded and gave a lot back. […] Need to be more patient and trust the trades that work.”
The point is…
In this hot market, when a stock can grow from one cent to 21 cents in two days, that is something you should focus on…
Let’s look at another play…
TOMI Environmental Solutions (OTCQB: TOMZ)
TOMZ first hit my watchlist back on February 5. It was an early spiker on news about its SteraMist disinfectant product. On February 4, TOMI announced registration with China’s CDC. On February 27, the company announced several countries were using SteraMist.
Before I review my recent TOMZ trade, here’s the six-month chart:
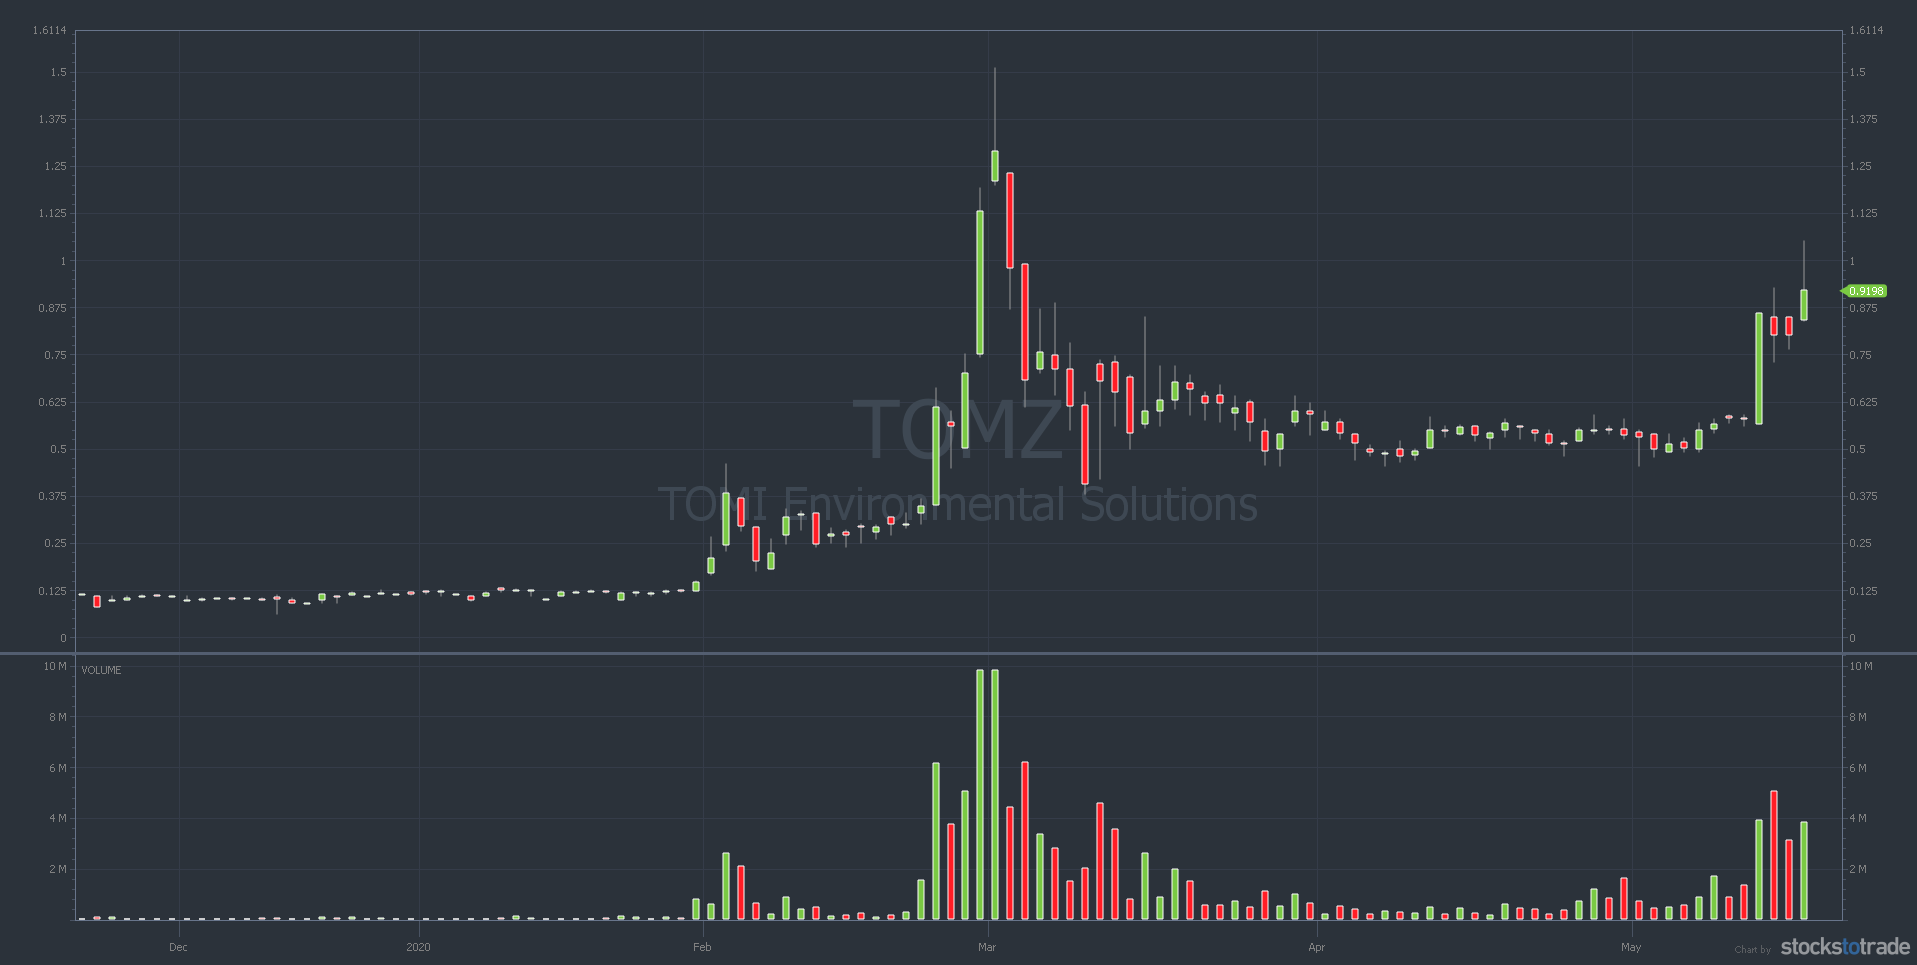
I’ve traded TOMZ six times in the past three months. But my trade on May 18 was by far the best. It was a classic morning spike after the company reported awesome earnings. TOMZ has spiked fast in the past, so my goal was a quick 10%–20%.
Take a look at the TOMZ chart from May 18:
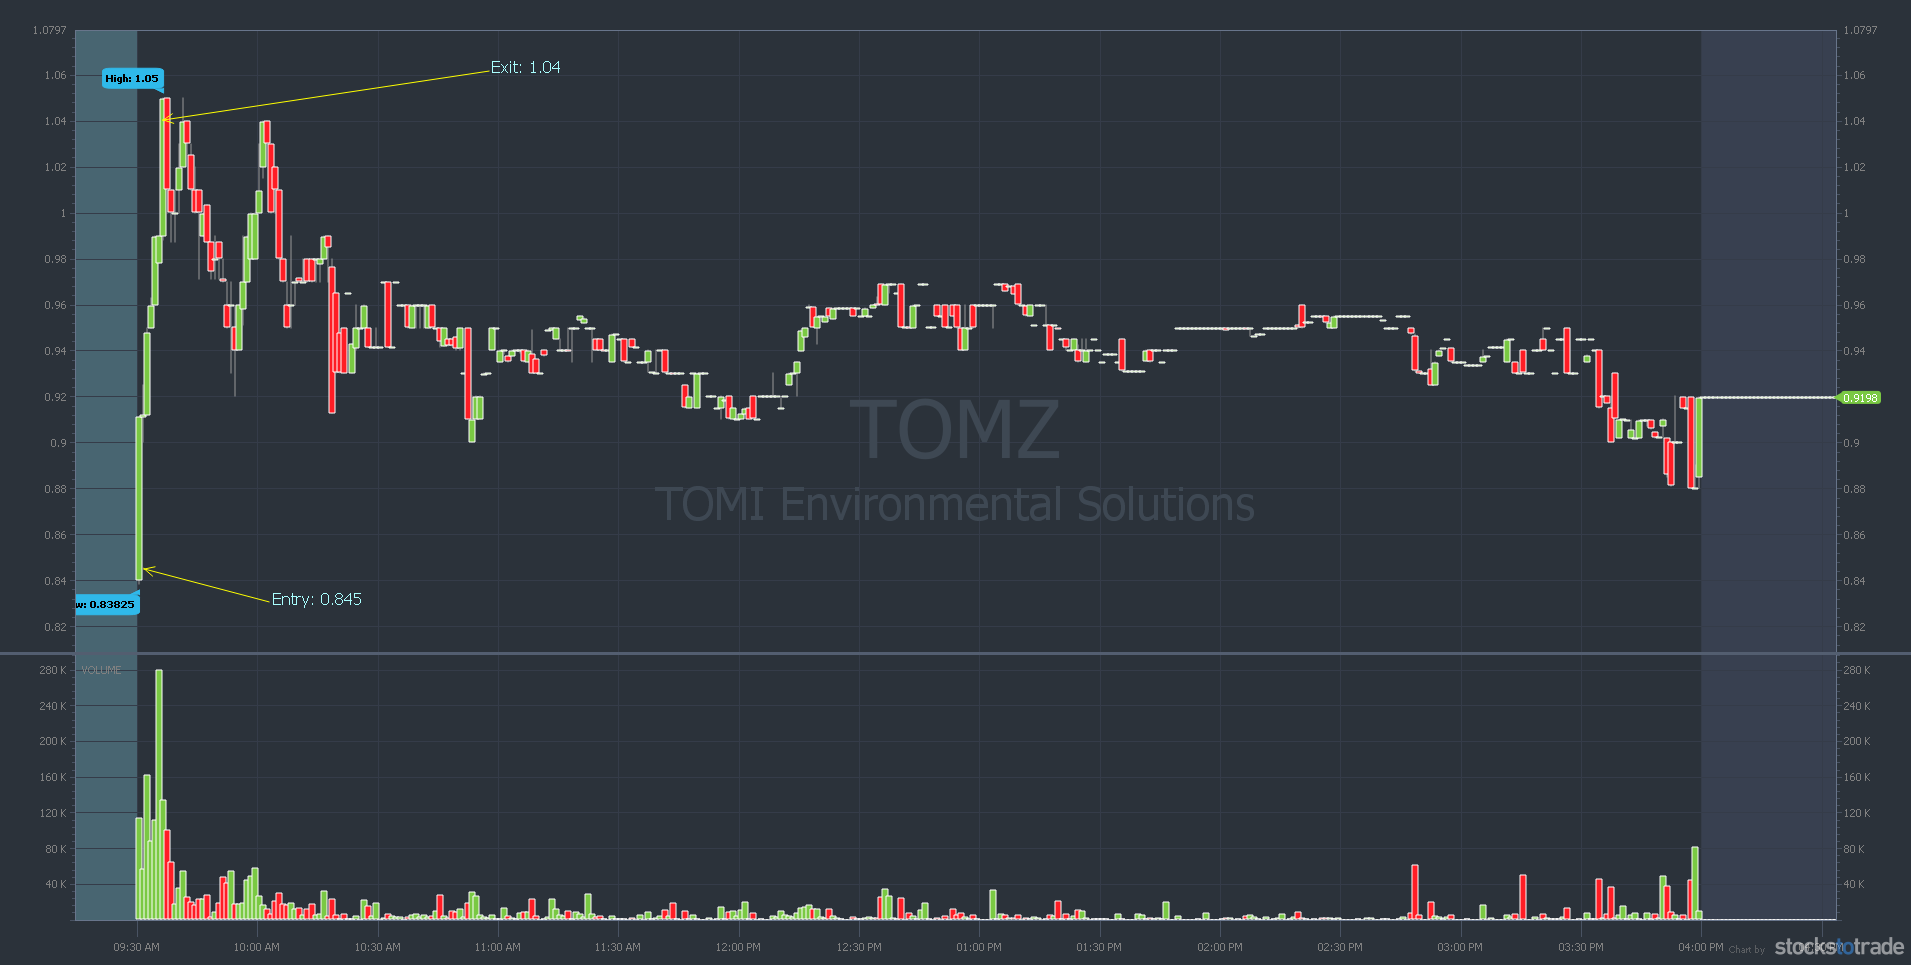
As you can see from the chart, TOMZ spiked fast. I took the easy 23.08% win for $2,730** in profit. It was a GREAT way to start the week.
(**My results are not typical. I have exceptional knowledge and skills developed over time. Most traders lose money and trading is risky. Do your due diligence and never risk more than you can afford.)
Let’s take a look at another low-priced spiker…
AgEagle Aerial Systems Inc. (AMEX: UAVS)
I’ve written about UAVS a few times recently. The stock could’ve helped you grow a small trading account considerably. But it was a ‘buy the rumor, sell the news’ play. It caught a lot of traders on the wrong side of the move.
First, take a look at the UAVS three-month chart:
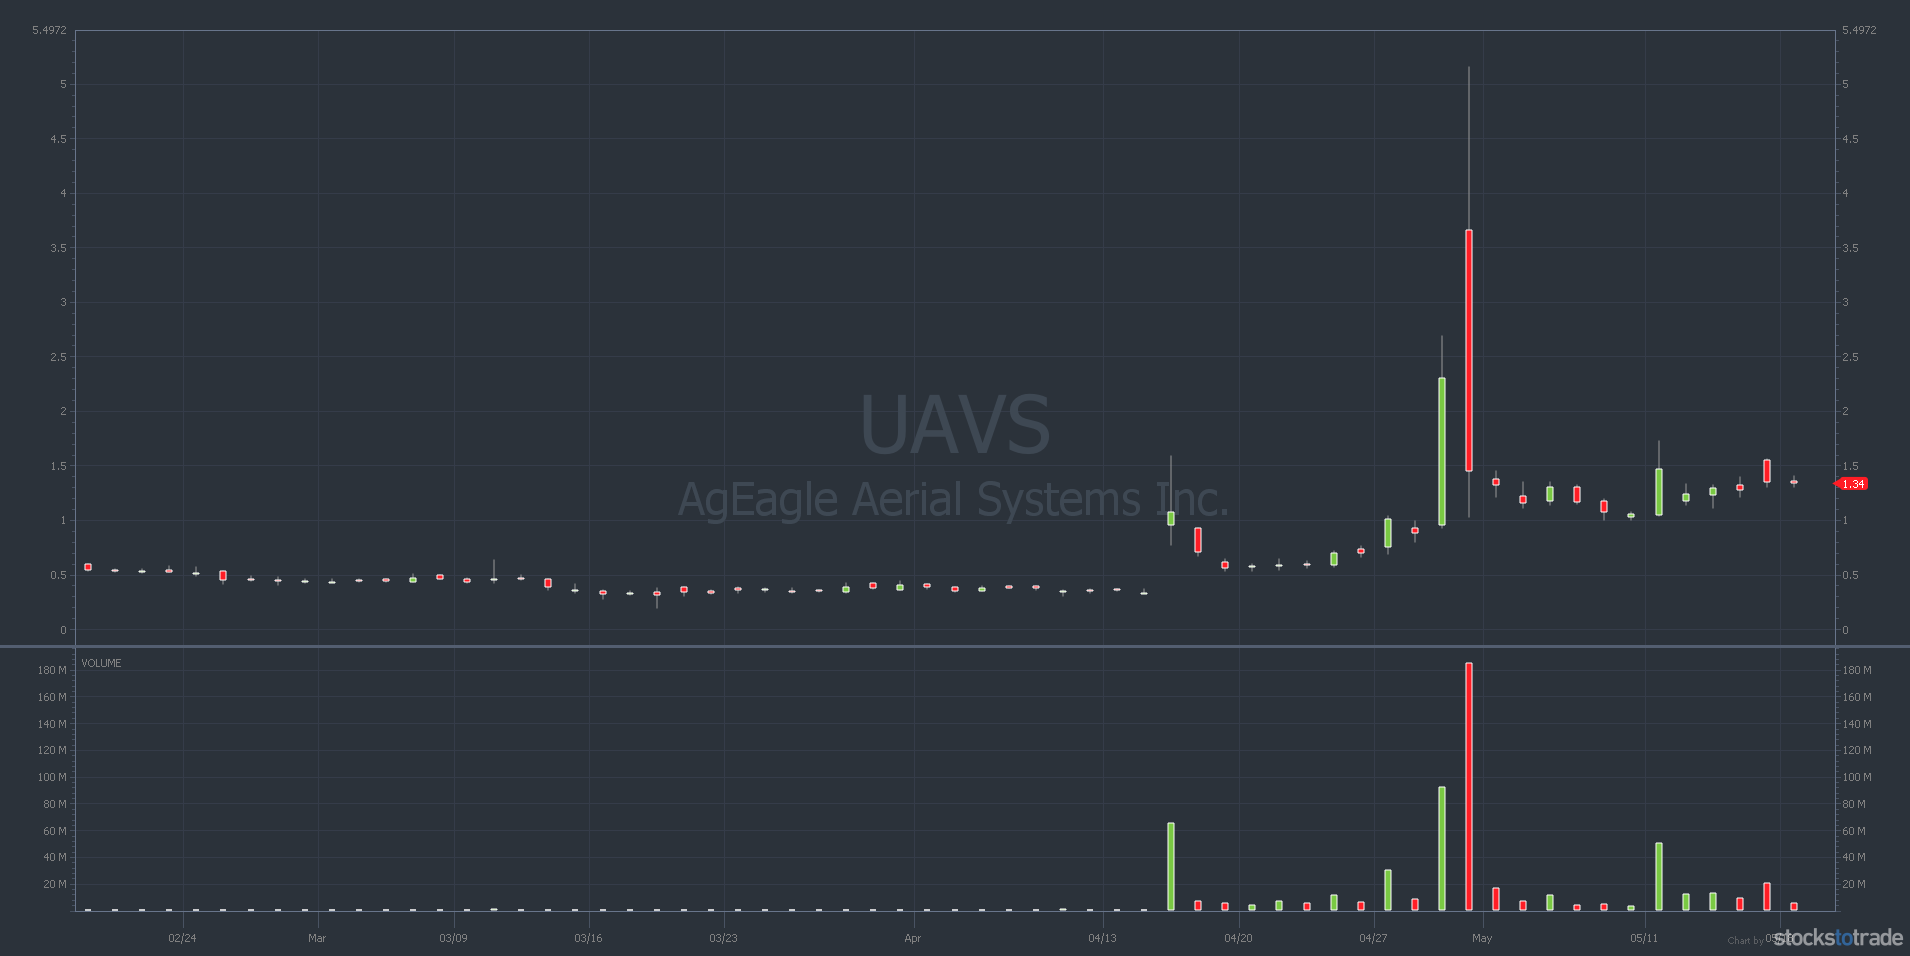
That big red candle in the chart above was when the actual news hit. It was a conference call — and it was a joke. The awesome thing is, you had two days to play the front side of this spike.
Anyone who understands the concept of ‘buy the rumor, sell the news’ could’ve played the backside as well.
Check out this chart from April 21 to May 1…
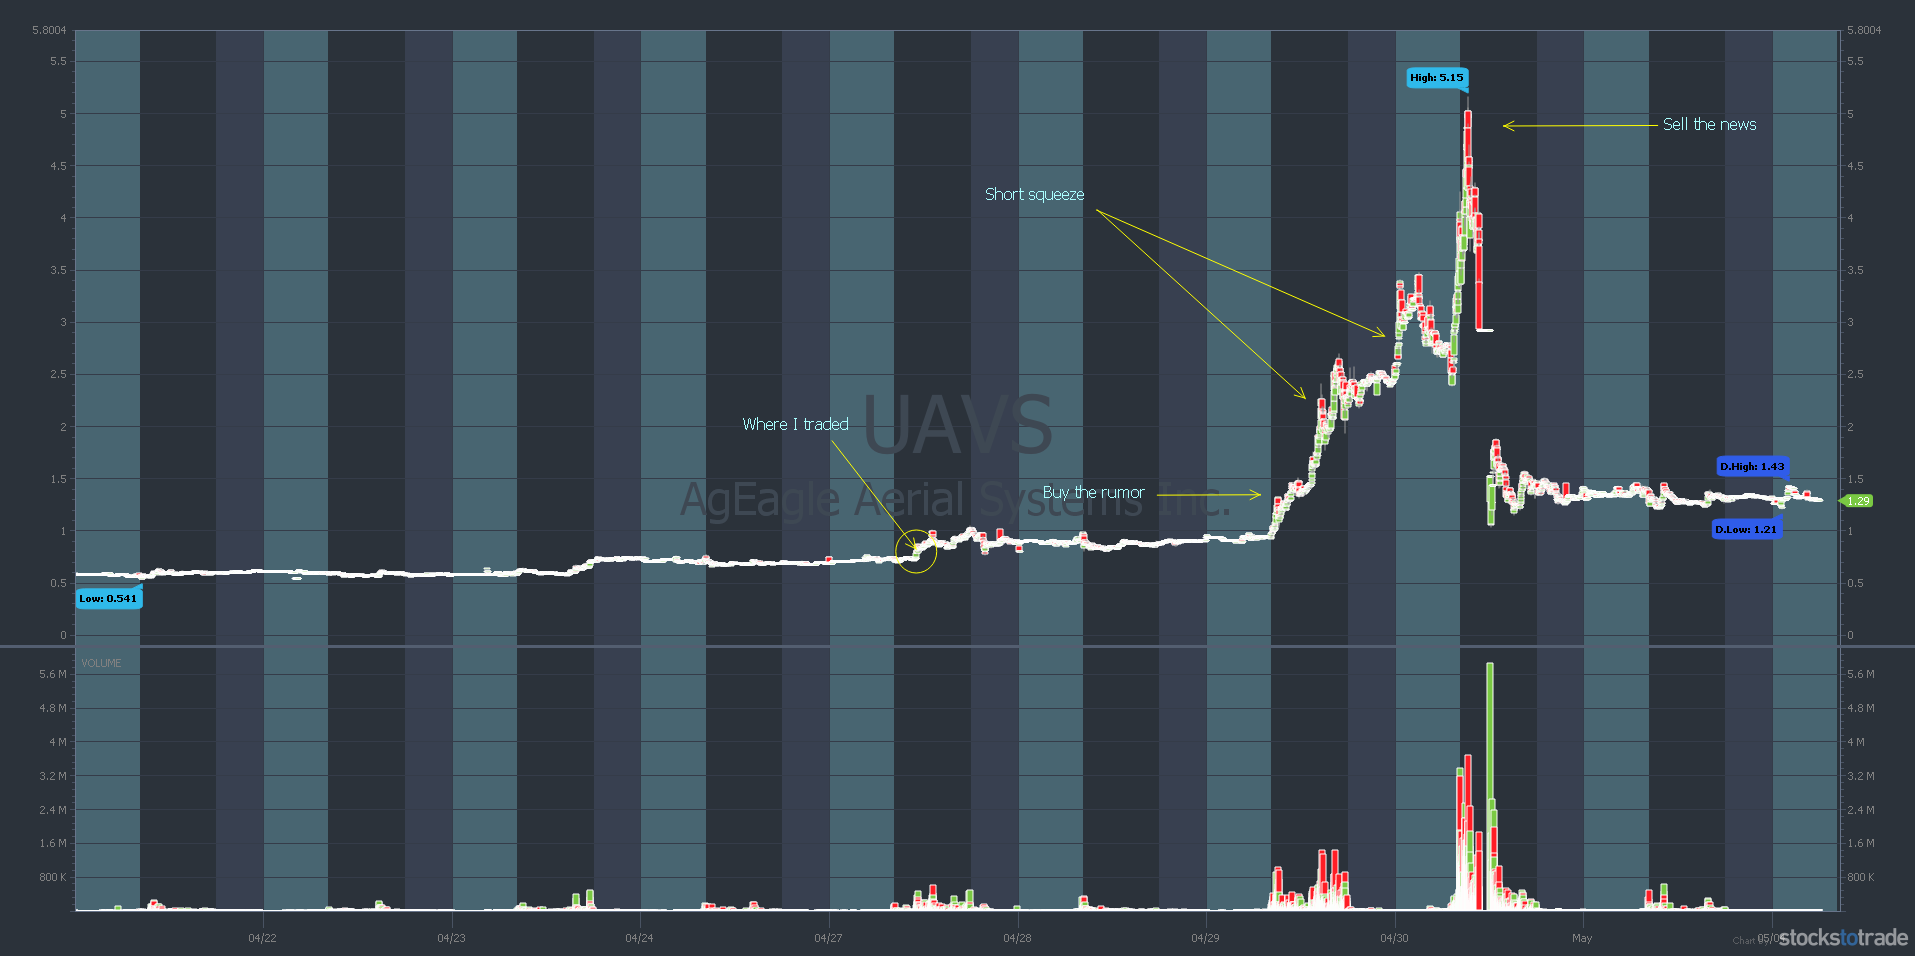
On April 27, the drone company announced a partnership to deliver medicine to the elderly. That was my buy on the chart above. But the stock didn’t really spike until a few days later. Read more about that trade in this Monday Motivation post.
The bottom line … UAVS went from 88 cents to over $5 per share. So, more than five times your money. That’s how to grow a small trading account…
Lessons to Take From These Plays
It can be challenging to start with a small account … But with the right education and intelligent trades, it’s possible to build a small account right now.
This isn’t to say you should EVER just buy any random penny stock. If it has a first day runup with news like SPOM, you don’t need to be afraid to buy a stock that’s already up. It’s possible to get in without being first.
It’s a great market for speculative, even crappy little stocks. It’s a hot market for low-priced stocks … Are you ready to learn how to recognize these patterns?
Consider applying for my Trading Challenge. But remember: I don’t want losers or lazy people. I only want students who will watch and learn from lessons like this. I want self-sufficient traders ready to learn how to grow a small trading account in this insane market!
How are you trading during the crazy market? What’s your experience? Leave a comment and let me know!
The post How to Grow a Small Account in This Crazy Market Now appeared first on Timothy Sykes.