I have a routine that I’ve implemented where I typically review market action around 10:00am ET, 30 minutes after the market has opened. It’s not at all unusual to see uptrending stocks down in the morning so running scans at about that 30 minute mark can generate very profitable trading ideas. Before I get to this point, however, I need to have already done my homework in setting up ChartLists to organize everything and save myself valuable time. Here are 2 key steps to consider in developing your own routine and improving your trading results:
Establishing Watch Lists
I have my own Watch Lists set up and maintained constantly. I use various ChartLists to organize my “homework”. As a former practicing CPA, I value companies that execute their business plans. For me, that involves beating quarterly revenue and EPS estimates. That’s what Wall Street expects. If you’re going to attract their dollars and their clients’ dollars, you need to provide evidence that you’re worth their investment. Falling short of expectations is no way to do that.
So my first ChartList is my Strong Earnings ChartList (SECL). Use whatever source you like to obtain earnings information, but I prefer Zacks. Every day I scour the earnings reports and see which companies have beaten Wall Street consensus estimates as to both revenues and earnings per share (EPS). If those companies also are liquid (average trading 200,000 shares a day or more) and look solid technically (show relative strength vs. their peers and the benchmark S&P 500 and also appear to be trending higher), then I include them in my SECL. I’ll briefly annotate a couple of support/resistance lines that I want to watch. That way, I don’t forget about a company and then see it 30% higher two weeks later and say “oh yeah, I remember looking at that stock!” ChartLists keep you organized, save your homework, and prepare you for that upcoming winning trade.
Let me give you an example of how I use the ChartList. I’m a fan of health care stocks because they’ve been leading the market higher since the March 23rd low – and even prior to that. Progyny (PGNY), a health care provider, posted earnings results on May 12th. It had closed at 20.49 prior to reporting its results. After posting revenues of $81.02 million, which easily beat estimates of $72.78 million, and EPS of $.04, quadrupling the expected $.01, PGNY gapped higher and opened at 25.05. Prior price resistance was easily identified by three prior tops from 23.95-24.05. I didn’t want to chase PGNY at its opening price, but I had identified two key support levels – the 23.95-24.05 price support and gap support all the way back down at 20.49. In between those two levels was the rising 20 day EMA, which at that time, was slightly above 22.00. On May 14th, I had pulled up my SECL and viewed it in Summary form and by health care stocks. I saw that PGNY was trading down so I placed my initial order to buy at 24.05. It executed that afternoon. My strategy was to buy PGNY at 3 levels – first at price support, next at the rising 20 day EMA, and finally at gap support. Only my initial entry triggered, but I quickly was able to take a nice profit (albeit on fewer shares) at the post-earnings high at 27.49 two days after entering the trade. It turned out to be a 14% winner in two trading days. Here’s a look at the chart:
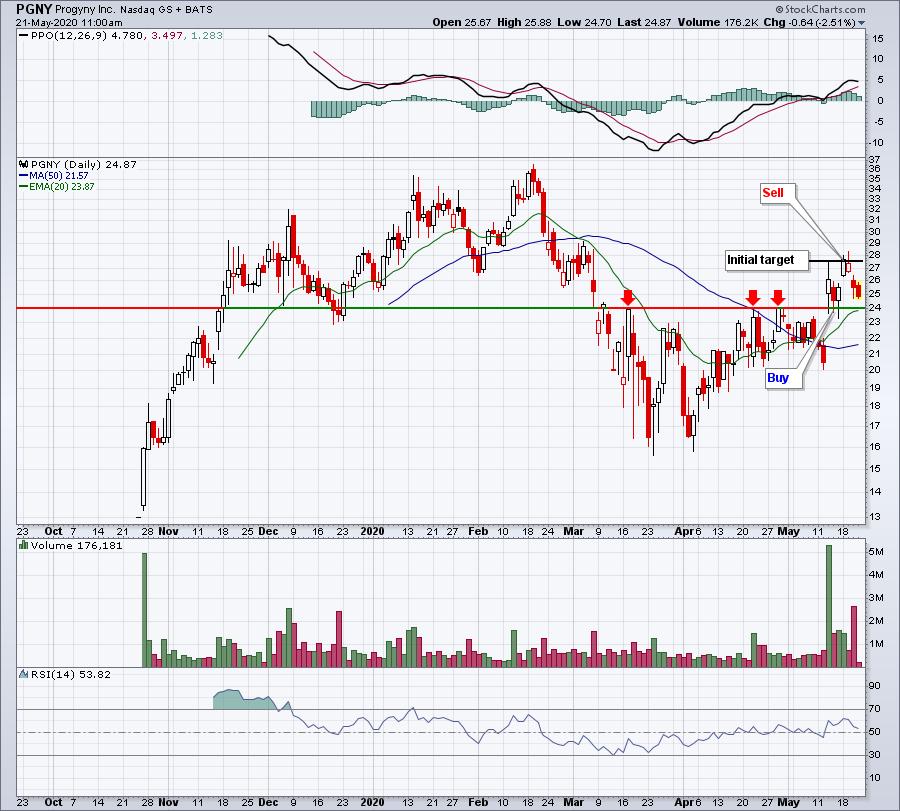
The key point here is that without doing my homework and then using the ChartList feature, this trade opportunity would likely have been missed.
Scanning ChartLists
When I’m asked what my favorite tools and features are at StockCharts.com, I do not hesitate. For me, it’s definitely the scan engine and the ChartLists. So being able to marry the two is absolutely essential to my trading strategy. I encourage every one of our EarningsBeats.com members to subscribe to StockCharts.com at the Extra level or above for one simple reason. As an Extra member, you can save up to 250 ChartLists. This feature is worth the upgrade from Basic in order to be able to organize your “homework” into different ChartLists.
I had a WebinAR (WAR) Room session that was open to the public on Friday morning to show how I put together my ChartLists and then how I scan against them. I’d be happy to share it with you. You can CLICK HERE to watch our video at YouTube. Be sure to subscribe to our YouTube channel while you’re there. 🙂
Happy trading!
Tom