Active inventory increased again, hitting a new peak for the year. Here are the same week inventory changes for the last four years (usually inventory is declining at this time of year):
2022: +5.0K
2021: -2.4K
2020: -0.9K
2019: -10.9K
Inventory bottomed seasonally at the beginning of March 2022 and is now up 135% since then. Altos reports inventory is up 33.7% year-over-year.
 Click on graph for larger image.
 Click on graph for larger image.
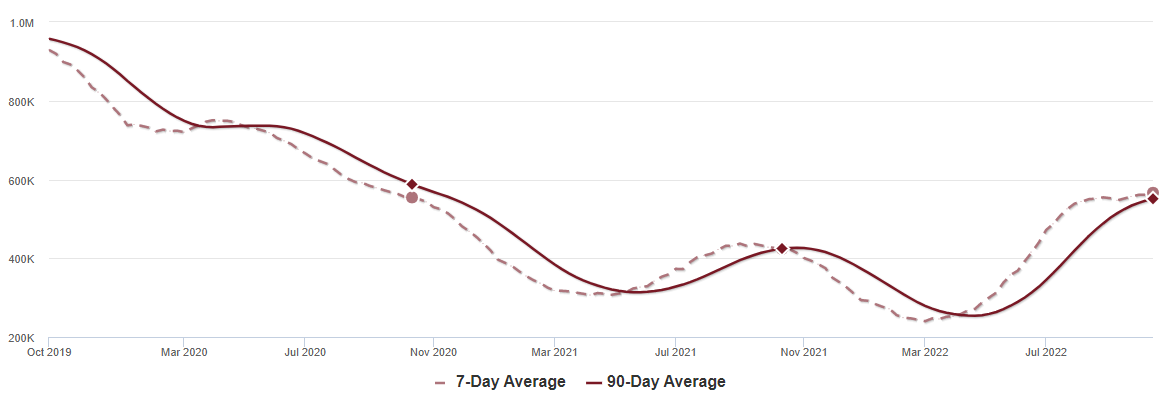
This inventory graph is courtesy of Altos Research.
As of October 14th, inventory was at 566 thousand (7-day average), compared to 561 thousand the prior week.
Compared to the same week in 2021, inventory is up 33.7% from 424 thousand, and compared to the same week in 2020 inventory is up 2.1% from 554 thousand. Compared to 3 years ago, inventory is down 39.5% from 936 thousand.
Here are the inventory milestones I’ve been watching for with the Altos data:
1. The seasonal bottom (happened on March 4, 2022, for Altos) ✅
2. Inventory up year-over-year (happened on May 20, 2022, for Altos) ✅
3. Inventory up compared to 2020 (happened on October 7, 2022, for Altos) ✅
4. Inventory up compared to 2019 (currently down 39.5%).

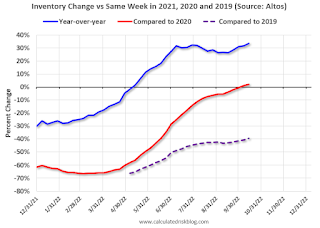
Here is a graph of the inventory change vs 2021 (milestone 2 above), 2020 (milestone 3) and 2019 (milestone 4).
The blue line is the year-over-year data, the red line is compared to two years ago, and dashed purple is compared to 2019.
A key will be if inventory continues to increase in the Fall.
Mike Simonsen discusses this data regularly on Youtube.