Active inventory decreased slightly. Here are the same week inventory changes for the last four years (usually inventory declines seasonally through the Winter):
2022: -3.5K (smaller than usual decrease in inventory)
2021: -6.9K
2020: -5.1K
2019: -6.3K
Altos reports inventory is down 0.6% week-over-week.
 Click on graph for larger image.
 Click on graph for larger image.
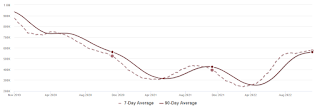
This inventory graph is courtesy of Altos Research.
As of November 11th, inventory was at 572 thousand (7-day average), compared to 575 thousand the prior week.
Compared to the same week in 2021, inventory is up 45.1% from 394 thousand, and compared to the same week in 2020 inventory is up 8.9% from 525 thousand. Compared to 3 years ago (2019), inventory is down 35.9% from 892 thousand.
Here are the inventory milestones I’ve been watching for with the Altos data:
1. The seasonal bottom (happened on March 4, 2022, for Altos) ✅
2. Inventory up year-over-year (happened on May 20, 2022, for Altos) ✅
3. Inventory up compared to 2020 (happened on October 7, 2022, for Altos) ✅
4. Inventory up compared to 2019 (currently down 35.9%).
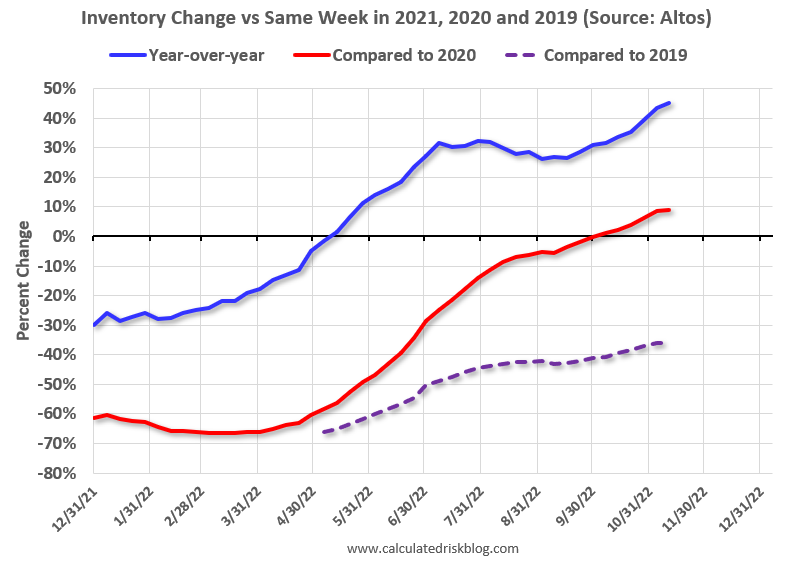
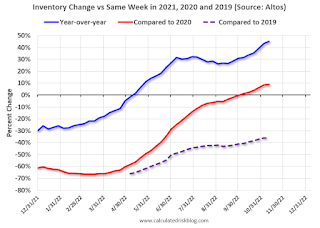
Here is a graph of the inventory change vs 2021 (milestone 2 above), 2020 (milestone 3) and 2019 (milestone 4).
The blue line is the year-over-year data, the red line is compared to two years ago, and dashed purple is compared to 2019.
A key will be if inventory declines slower than usual during the winter months.
Mike Simonsen discusses this data regularly on Youtube.