One of the key questions for 2021 is: Will inventory increase as the pandemic subsides, or will inventory decrease further in 2021?
Tracking inventory will be very important this year.
 Click on graph for larger image in graph gallery.
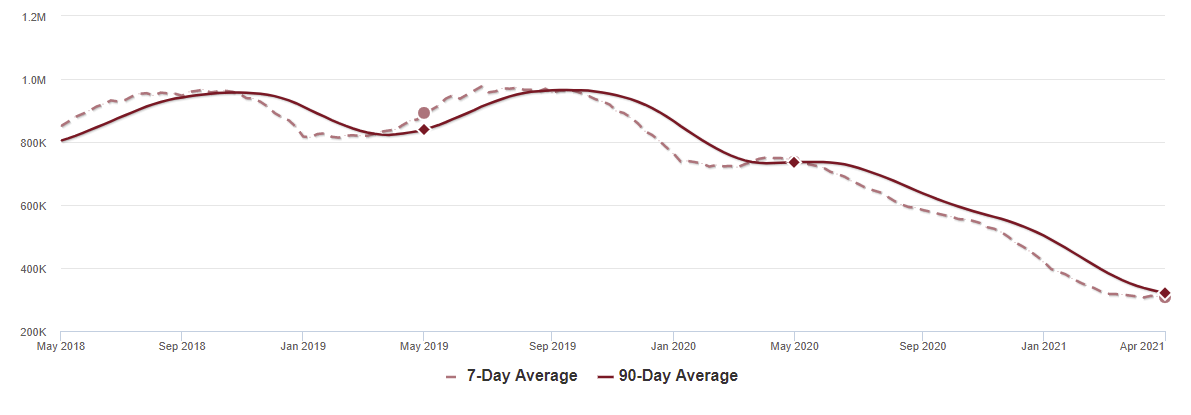
This inventory graph is courtesy of Altos Research.
As of April 30th, inventory was at 307 thousand (7 day average), compared to 738 thousand the same week a year ago. That is a decline of 58%.
A week ago, inventory was at 310 thousand, and was down 58% YoY. Seasonally, inventory might be at a bottom – this is the same level as three weeks ago at 307 thousand.
Mike Simonsen discusses this data regularly on Youtube.