Tracking existing home inventory will be very important this year.
 Click on graph for larger image in graph gallery.
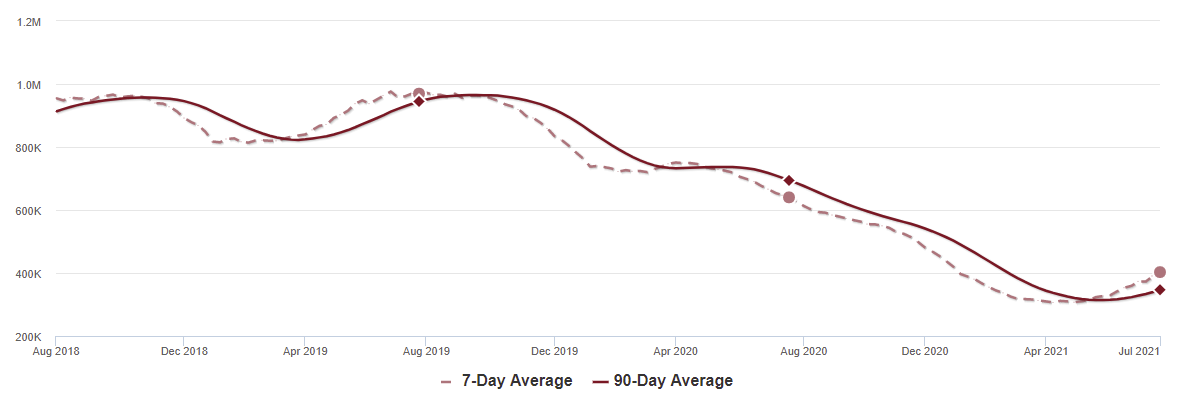
This inventory graph is courtesy of Altos Research.
As of July 23rd, inventory was at 403 thousand (7 day average), compared to 640 thousand the same week a year ago. That is a decline of 37.1%.
A week ago, inventory was at 391 thousand, and was down 39.6% YoY.
Seasonally, inventory has bottomed. Inventory was about 31.4% above the record low in early April.
Mike Simonsen discusses this data regularly on Youtube.
Altos Research has also seen a significant pickup in price decreases – almost back to the level of a year ago – although still well below a normal rate for July.