Inventory is increasing rapidly. Inventory bottomed seasonally at the beginning of March 2022 and is now up 118% since then. More than double!
Altos reports inventory is up 30.5% year-over-year and is now 20.2% above the peak last year.
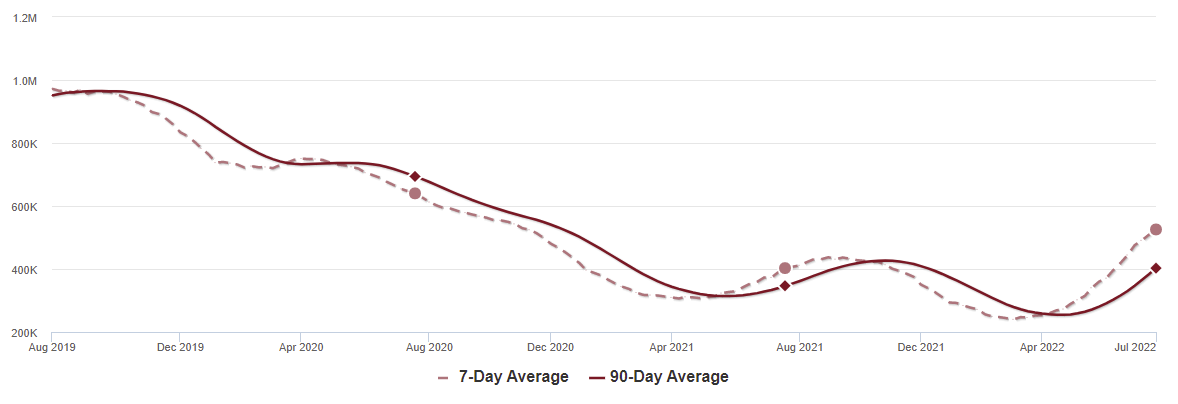 Click on graph for larger image.
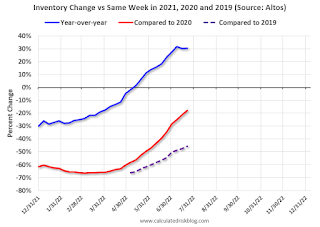
This inventory graph is courtesy of Altos Research.
As of July 22nd, inventory was at 526 thousand (7-day average), compared to 509 thousand the prior week.
Inventory was up 3.3% from the previous week. Inventory is increasing much faster than normal for this time of year (both in percentage terms and in total inventory added).
Inventory is still historically low. Compared to the same week in 2021, inventory is up 30.5% from 403 thousand, however compared to the same week in 2020 inventory is down 17.9% from 640 thousand. Compared to 3 years ago, inventory is down 45.8% from 969 thousand.
Here are the inventory milestones I’m watching for with the Altos data:
1. The seasonal bottom (happened on March 4th for Altos) ✅
2. Inventory up year-over-year (happened on May 13th for Altos) ✅
3. Inventory up compared to two years ago (currently down 17.9% according to Altos)
4. Inventory up compared to 2019 (currently down 45.8%).

Here is a graph of the inventory change vs 2021, 2020 (milestone 3 above) and 2019 (milestone 4).
The blue line is the year-over-year data, the red line is compared to two years ago, and dashed purple is compared to 2019.
Two years ago (in 2020) inventory was declining all year, so the two-year comparison will get easier all year.
Based on the recent increases in inventory, my current estimate is inventory will be up compared to 2020 in late August of this year (next month), and back to 2019 levels at the beginning of 2023.
Mike Simonsen discusses this data regularly on Youtube.