The occupancy rate is down 16.7% compared to the same week in 2019.
U.S. weekly hotel occupancy fell one point from the previous week, according to STR‘s latest data through March 27.
March 21-27, 2021:
• Occupancy: 57.9%
• Average daily rate (ADR): US$108.31
• Revenue per available room (RevPAR): US$62.68The 57.9% absolute occupancy was a 160.8% increase from the comparable, pandemic-affected week last year, but more importantly, represented more than 83% of occupancy regained from the 2019 benchmark. More than 21 million rooms were sold for the second week in a row, however, it was the first time in four weeks that the metric fell week over week, which is indicative of softening in the spring break demand that had boosted levels previously.
emphasis added
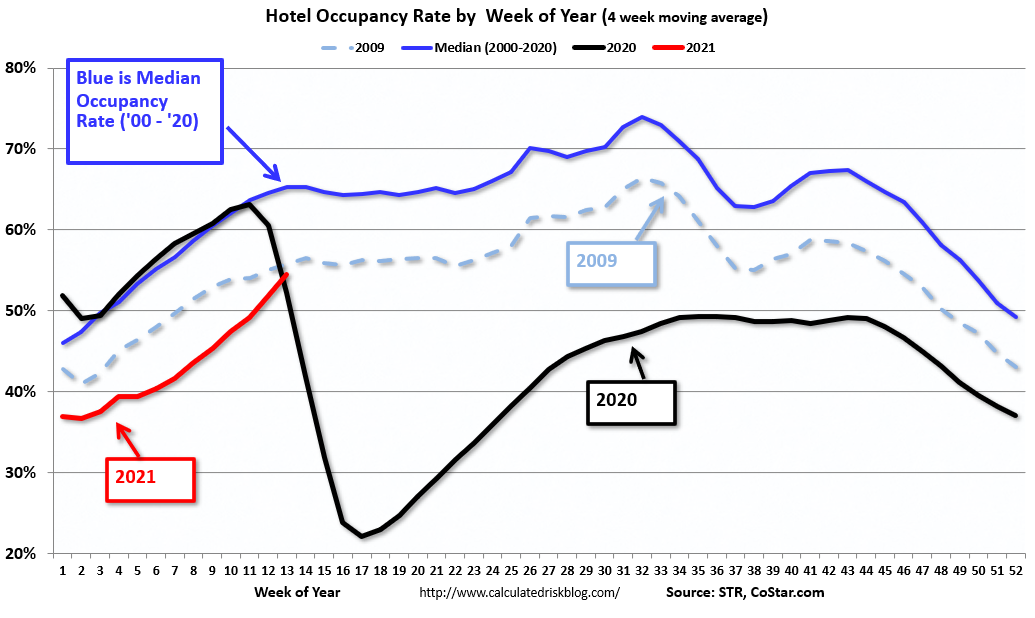
The following graph shows the seasonal pattern for the hotel occupancy rate using the four week average.
 Click on graph for larger image.
The red line is for 2021, black is 2020, blue is the median, and dashed light blue is for 2009 (the worst year since the Great Depression for hotels prior to 2020).
Note: Y-axis doesn’t start at zero to better show the seasonal change.