STR data ending with 6 June showed another small rise from previous weeks in U.S. hotel performance. Year-over-year declines remained significant although not as severe as the levels recorded previously.
31 May through 6 June 2020 (percentage change from comparable week in 2019):
• Occupancy: 39.3% (-45.3%)
• Average daily rate (ADR): US$85.01 (-35.9%)
• Revenue per available room (RevPAR): US$33.43 (-65.0%)“Not much different from previous weeks, occupancy continued to climb toward the 40% mark with noticeably higher levels on Friday and Saturday,” said Jan Freitag, STR’s senior VP of lodging insights. “The lower end of the market continued to lead, with economy properties finally selling more than half of their rooms again, although all hotel classes were comfortably above 20%. Drilling down to the submarket level, the highest occupancy levels were recorded in various pockets of New York City as well as popular leisure spots in Florida, Texas and South Carolina. Thanks to higher demand, one submarket, West Palm Beach, showed a 21.0% year-over-year ADR increase for the entire week.
“Once again, there wasn’t a significant week-to-week change in the markets that were the focus of protests and unrest. Like we noted last week, there was not a great deal of demand in downtown areas previously, and most of the major metros showed small gains from the previous week.”
emphasis added
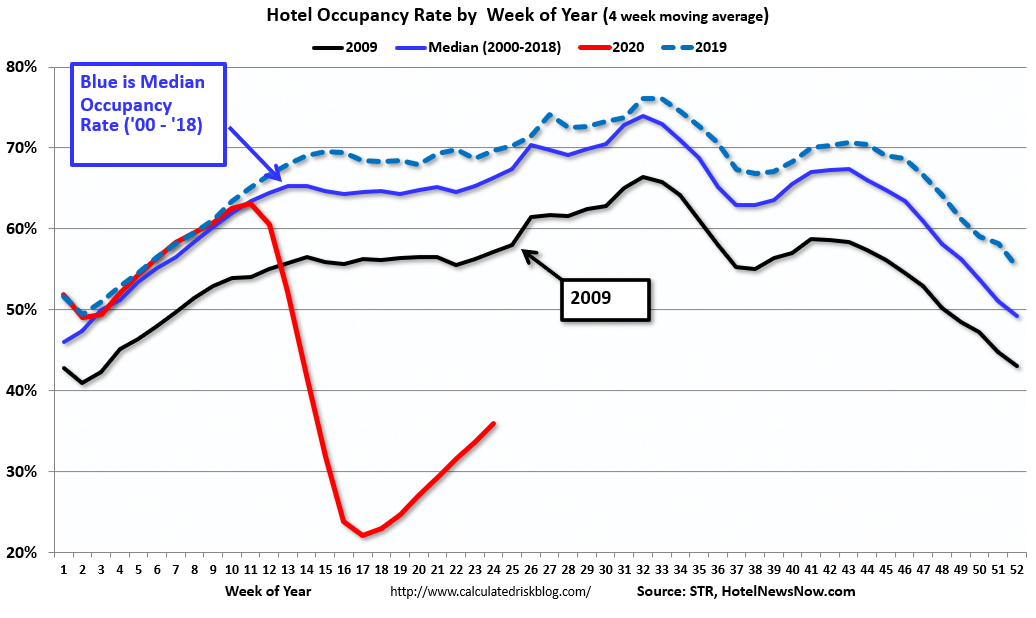
The following graph shows the seasonal pattern for the hotel occupancy rate using the four week average.
 Click on graph for larger image.
The red line is for 2020, dash light blue is 2019, blue is the median, and black is for 2009 (the worst year probably since the Great Depression for hotels).
Usually hotel occupancy starts to pick up seasonally in early June. So even though the occupancy rate was up slightly compared to last week, the year-over-year decline was actually worse this week than last week (45.3% decline vs. 43.2% decline last week).
Note: Y-axis doesn’t start at zero to better show the seasonal change.