U.S. hotel performance data for the week ending 20 June showed another small rise from previous weeks and less severe year-over-year declines, according to STR.
14-20 June 2020 (percentage change from comparable week in 2019):
• Occupancy: 43.9% (-41.8%)
• Average daily rate (ADR): US$92.20 (-31.7%)
• Revenue per available room (RevPAR): US$40.48 (-60.3%)“Occupancy was up another couple percentage points from last week, marking the 10th consecutive week of such an increase,” said Jan Freitag, STR’s senior VP of lodging insights. “Demand continues to be pushed upward by drive-to spots and the destinations with outdoor offerings such as beaches. For the week, 10 submarkets showed occupancy above 70%, led by Panama City (88.7%), where occupancy was just 0.7% lower than the comparable week in 2019.”
emphasis added
The following graph shows the seasonal pattern for the hotel occupancy rate using the four week average.
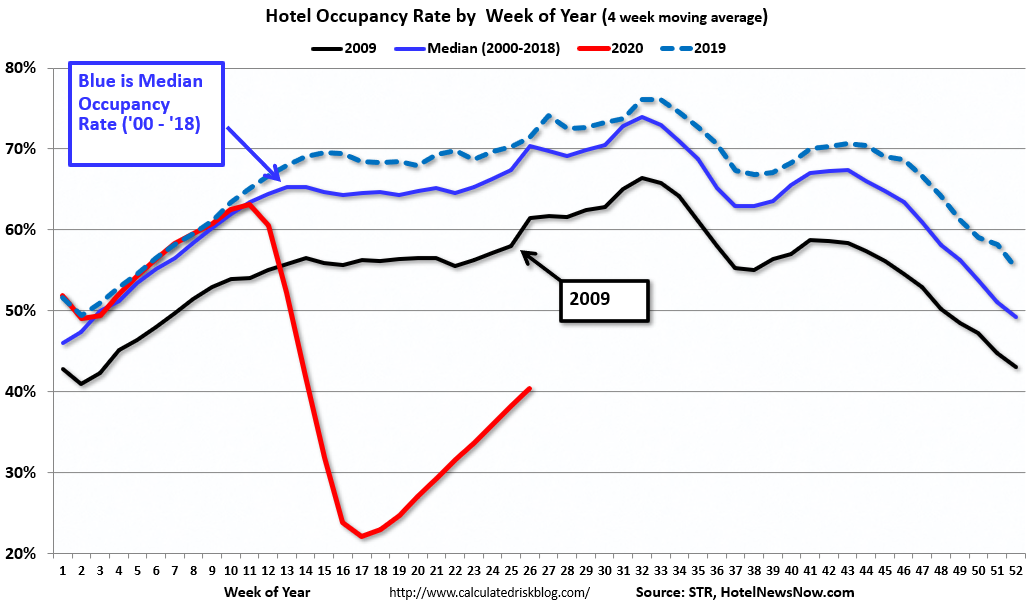 Click on graph for larger image.
The red line is for 2020, dash light blue is 2019, blue is the median, and black is for 2009 (the worst year probably since the Great Depression for hotels).
Usually hotel occupancy starts to pick up seasonally in early June. So even though the occupancy rate was up slightly compared to last week, the year-over-year decline was only slightly improved this week compared to the previous three weeks (41.8% decline vs 43.4% last week, 45.3% two weeks ago, and 43.2% decline three weeks ago).
The improvement appears related mostly to leisure travel as opposed to business travel.
Note: Y-axis doesn’t start at zero to better show the seasonal change.