U.S. hotel performance data for the week ending 18 July showed slightly higher occupancy and room rates from the previous week, according to STR.
12-18 July 2020 (percentage change from comparable week in 2019):
• Occupancy: 47.5% (-38.9%)
• Average daily rate (ADR): US$98.56 (-28.0%)
• Revenue per available room (RevPAR): US$46.87 (-56.0%)
emphasis added
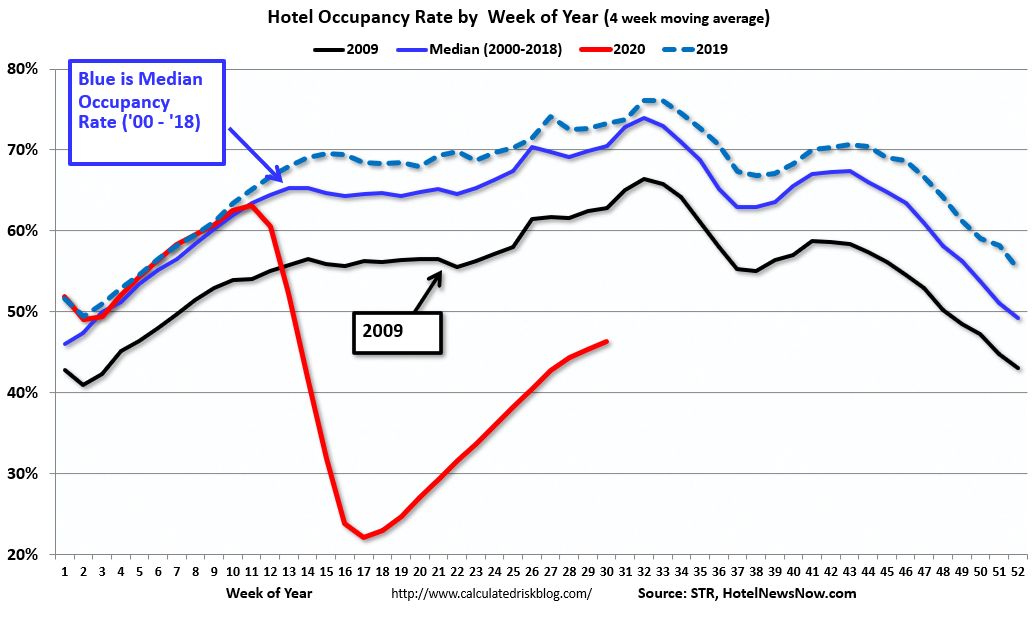
The following graph shows the seasonal pattern for the hotel occupancy rate using the four week average.
The occupancy rate for the last five weeks was 43.9%, 46.2%, 45.6%, 45.9% and 47.5% The increases in occupancy have slowed and are well below the median for this week of 78%.
 Click on graph for larger image.
The red line is for 2020, dash light blue is 2019, blue is the median, and black is for 2009 (the worst year probably since the Great Depression for hotels).
Usually hotel occupancy starts to pick up seasonally in early June. So some of the recent pickup might be seasonal (summer travel). Note that summer occupancy usually peaks at the end of July or in early August.
According to STR, the improvement appears related mostly to leisure travel as opposed to business travel.
Note: Y-axis doesn’t start at zero to better show the seasonal change.