That’s never an easy question to answer while you’re in the midst of a downtrend. It’s a whole lot easier to be a Monday Morning Quarterback and say it’s over when you’ve returned to a new all-time high. That’s the challenge of what we do. Wall Street will not hold up a sign that reads “You Can Start Buying Again”. We have to analyze the charts, look “under the hood” of the stock market, assess our risk, and develop our strategy. Emotionally, this part is always grueling. Notice how you say to yourself, “I’m not buying until stock prices pull back”, then stock prices pull back and you can’t pull the trigger for fear that they’ll go lower? The market is volatile and putting your hard-earned money at risk is difficult. I get it.
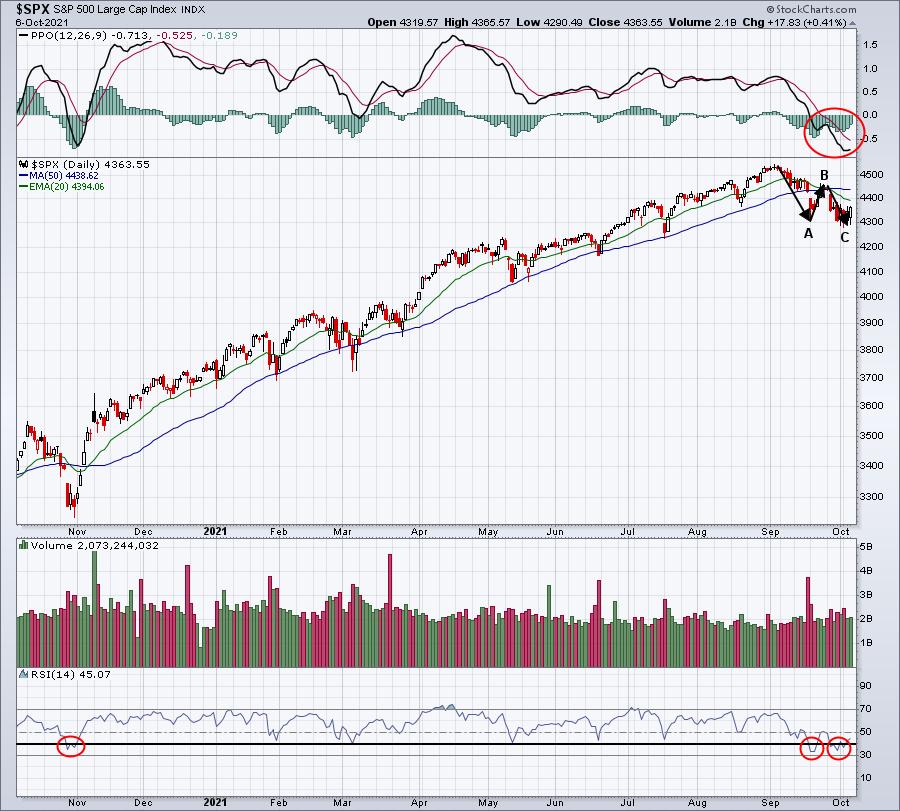
But the show must go on, so let’s look at signals that would suggest Wall Street has turned the corner and we’re trending higher again. That last part “trending higher again” should be somewhat obvious when you look at a chart of the S&P 500, because we are NOT currently trending higher:

An A-B-C correction pattern is the definition of a short-term downtrend. Price action beneath the 20-day EMA, which is beneath the 50-day SMA is a short-term bearish configuration. RSI lows beneath 40 indicate the potential of a longer-lasting downtrend and even a possible (gasp!) cyclical bear market. Let me say I don’t believe we’re in such a bear market, but you have to be objective and at least consider the possibility given the RSI drop.
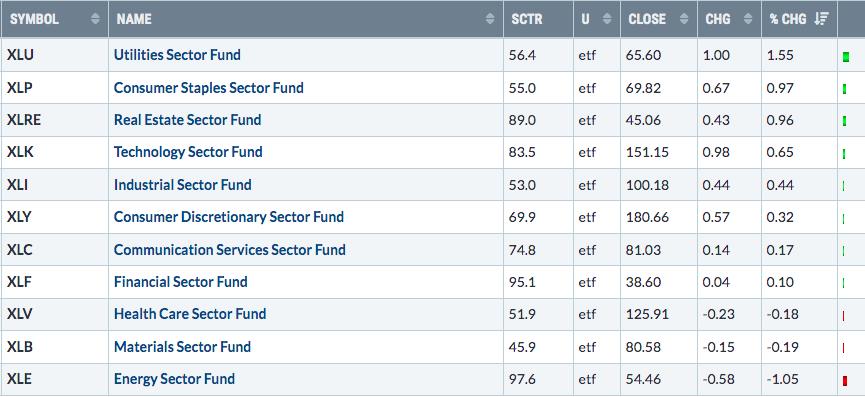
We won’t get technical confirmation that this downtrend is over until we see the chart configuration change. At a bare minimum, the S&P 500 must close back above the 20-day EMA. An uptrend CANNOT begin without that price action. Therefore, remaining at least a bit cautious for now makes perfectly good sense. One other potential problem was that Wednesday’s rally was led by defensive sectors, never a bullish signal:

One day’s leadership isn’t really much of a problem, but what if we rally again today with defensive stocks leading? What if, over the course of the next 2-3 weeks, the S&P 500 returns to or near all-time highs and defensive groups lead the charge throughout the period? Well, to me, that would be a much different story and one that would absolutely have me extremely cautious on the rally.
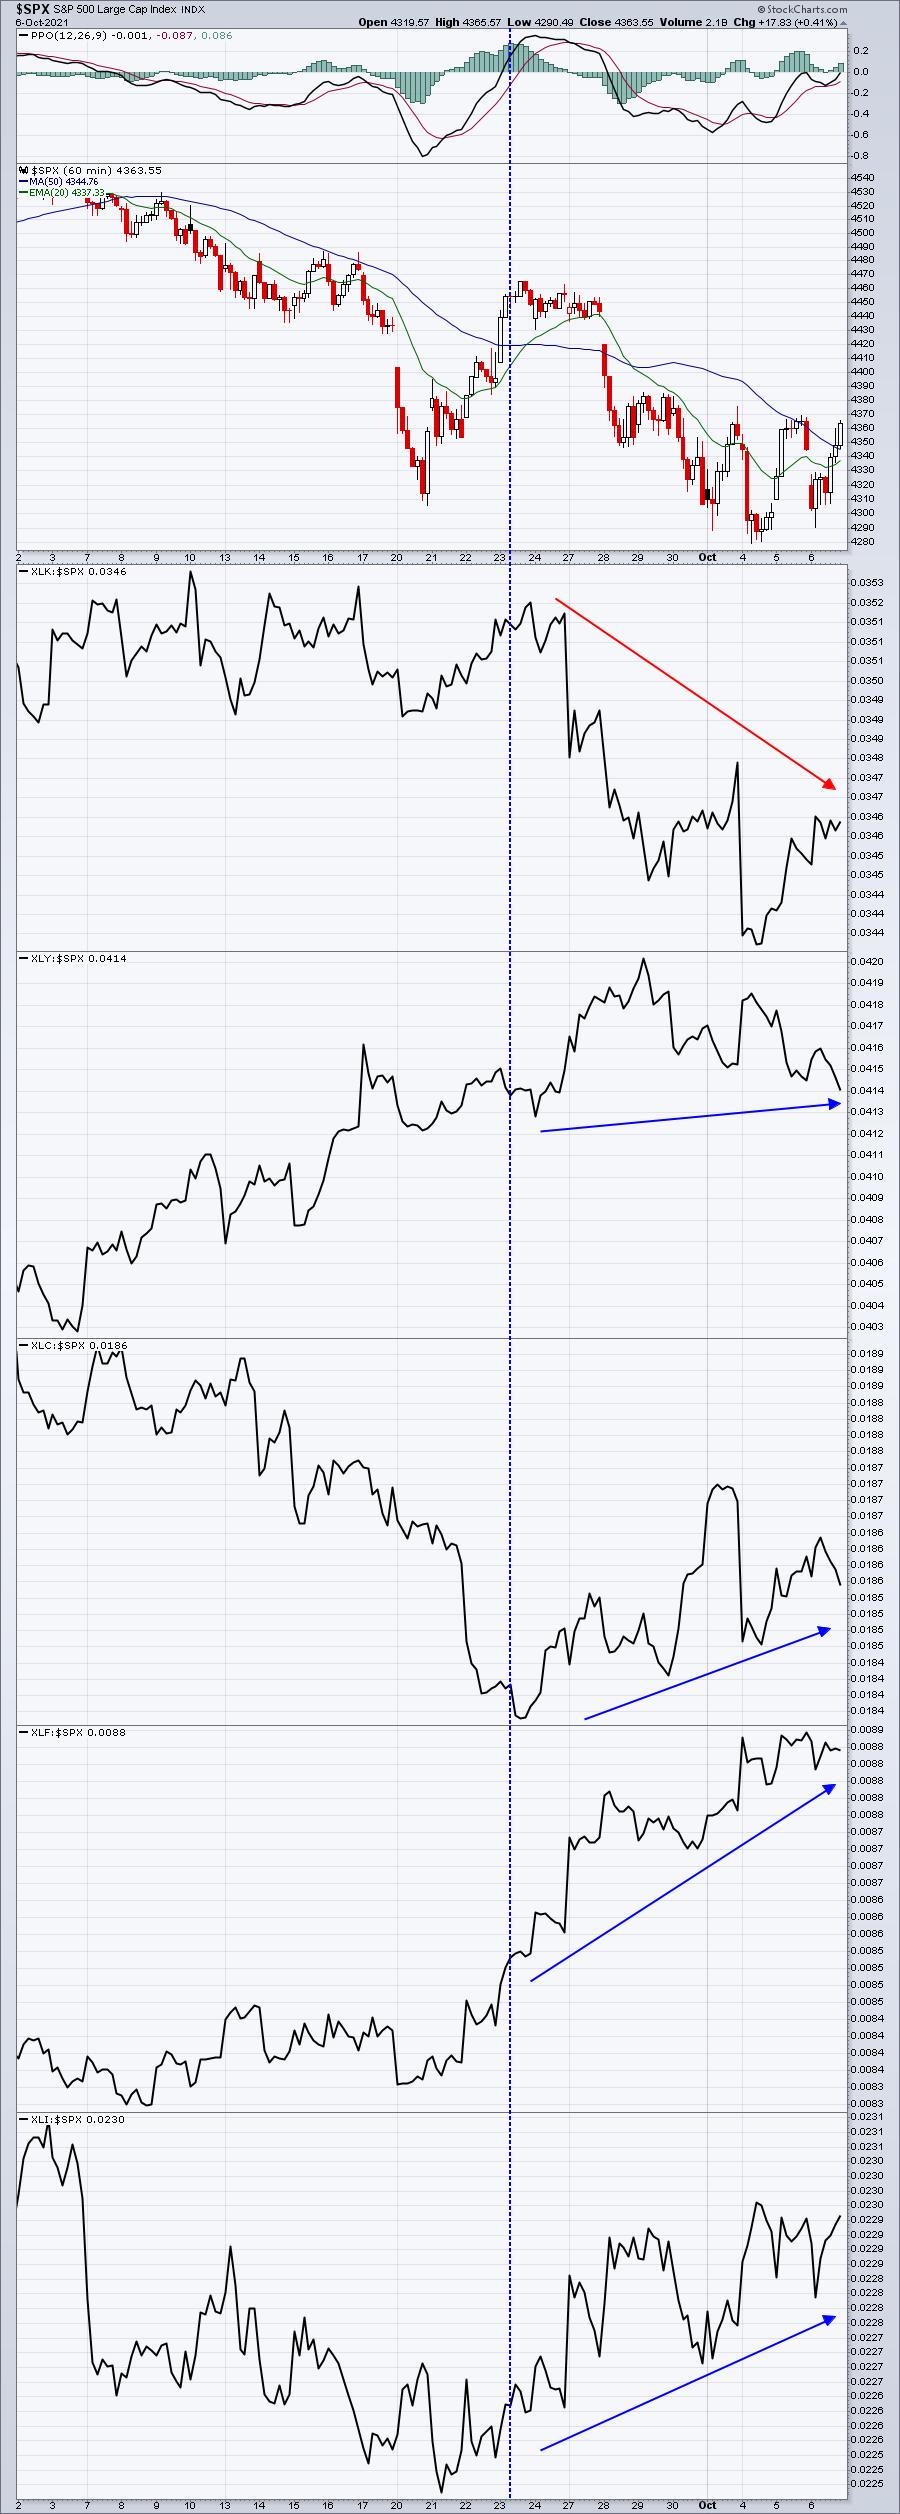
Having said all this, let me be clear. I’m convinced this is a normal A-B-C three-wave counter trend selloff, which will lead to all-time highs being reached again during Q4. While yesterday’s rally saw Wall Street being defensive, professionals were not exiting aggressive positions ahead of the September selling – or even during it. Below is a 5-week hourly look at our 5 aggressive sectors on a relative basis vs. the S&P 500:

I would not consider this a mass exodus out of aggressive stocks. The blue-dotted vertical line marks the approximate time that the 10-year treasury yield ($TNX) broke out above 1.40% (TNX not pictured above). While most would agree that higher yields would provide headwinds for aggressive, growth-oriented stocks, only technology lost ground on a relative basis from the September 23rd TNX breakout through yesterday’s close. The other four sectors outperformed the S&P 500, a very bullish signal, in my view.
It appears that the A-B-C pattern most likely has ended, but Wednesday’s defensive stock leadership does at least give me reason to pause. Futures are up this morning and I’ll be interested to see what leadership looks like and whether the hourly chart continues to show building momentum (PPO above centerline – we finished squarely on the centerline on Wednesday).
Conclusion
I’m not sure. How’s that for conviction? For me, it’s about much more than just whether the S&P 500 moves higher. Let’s keep watching those “beneath the surface” signals and make informed decisions based on that. In the very near-term, I believe it continues to make sense to be a bit cautious. I LOVE the long-term chart and believe we’re still in the very early innings of what will be remembered as one of the strongest secular bull markets of our lifetime. However, short-term periods can be extremely volatile and dicey and we have one of those right now. Let’s take it a day at a time.
ChartFest 2021
I’m excited to announce that Grayson Roze, Vice President of Operations at StockCharts.com, and David Keller, Chief Market Strategist at StockCharts.com and host of The Final Bar, will join me for our first-ever “ChartFest 2021” to be held on Saturday, October 16th, beginning at 11:00am ET. More details will follow, but it will be FREE to anyone in our EarningsBeats.com community. This includes our paid subscribers and also our FREE EB Digest subscribers. To register, simply CLICK HERE and provide your name and email address (no credit card required)! It’s going to be an educational and fun event and I sure hope you can join us. Those registered, but who cannot attend live, will receive a recording to review at their leisure!
Happy trading!
Tom