Tuesday’s market shows mixed price action amid positive earnings reports and a 14% increase in home sales for September.
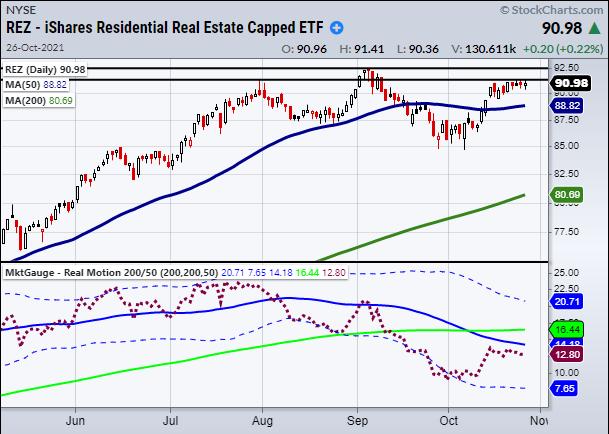
Focusing on the residential sector, many are looking for a top of the market, as home sales have skyrocketed since the pandemic began. Residential and Multisector Real Estate ETF (REZ) is one way to gauge the health of the housing market from a technical standpoint. Currently, REZ is creating a head-and-shoulders chart pattern, as seen in the above daily chart, and is sitting in a resistance area from the left shoulder. If the housing market is looking to top out, the recent highs hold key resistance to clear at $92.60. Above 92.60, REZ will enter price discovery, making it tougher to find potential topping areas.
Besides watching key resistance levels, we can also check momentum using MarketGauge’s Real Motion Indicator (RM). Looking at the bottom of the chart, we can see a large shift in momentum through RM. Notice how the 50-DMA broke underneath the 200-DMA, with RM (Red dotted line) sitting under the 50-DMA.
Though the price of REZ is holding over its 50-DMA, RM is clearly showing a different story. This gives us two ways to watch for a potential trade in REZ based on price and momentum. First, if RM can get back over its 50-DMA, it will show that momentum has improved, thus creating a potential buy zone. On the other hand, if the price breaks underneath its 50-DMA at $88.82, it will show that the price now agrees with the current weakening momentum.
Follow Mish on Twitter @marketminute for stock picks and more. Follow Mish on Instagram (mishschneider) for daily morning videos. To see updated media clips, click here.
ETF Summary
- S&P 500 (SPY): 454.05 Needs to hold as support.
- Russell 2000 (IWM): Needs to clear and hold over 229.84.
- Dow (DIA): 356.60 needs to hold as new support.
- Nasdaq (QQQ): 382.78 high to clear.
- KRE (Regional Banks): 71.60 support area.
- SMH (Semiconductors): 264.75 the 50-DMA.
- IYT (Transportation): Sitting in a resistance area.
- IBB (Biotechnology): 160.30 the 200-DMA could not hold.
- XRT (Retail): Watching to hold over the 50-DMA at 93.53.
Forrest Crist-Ruiz
MarketGauge.com
Assistant Director of Trading Research and Education