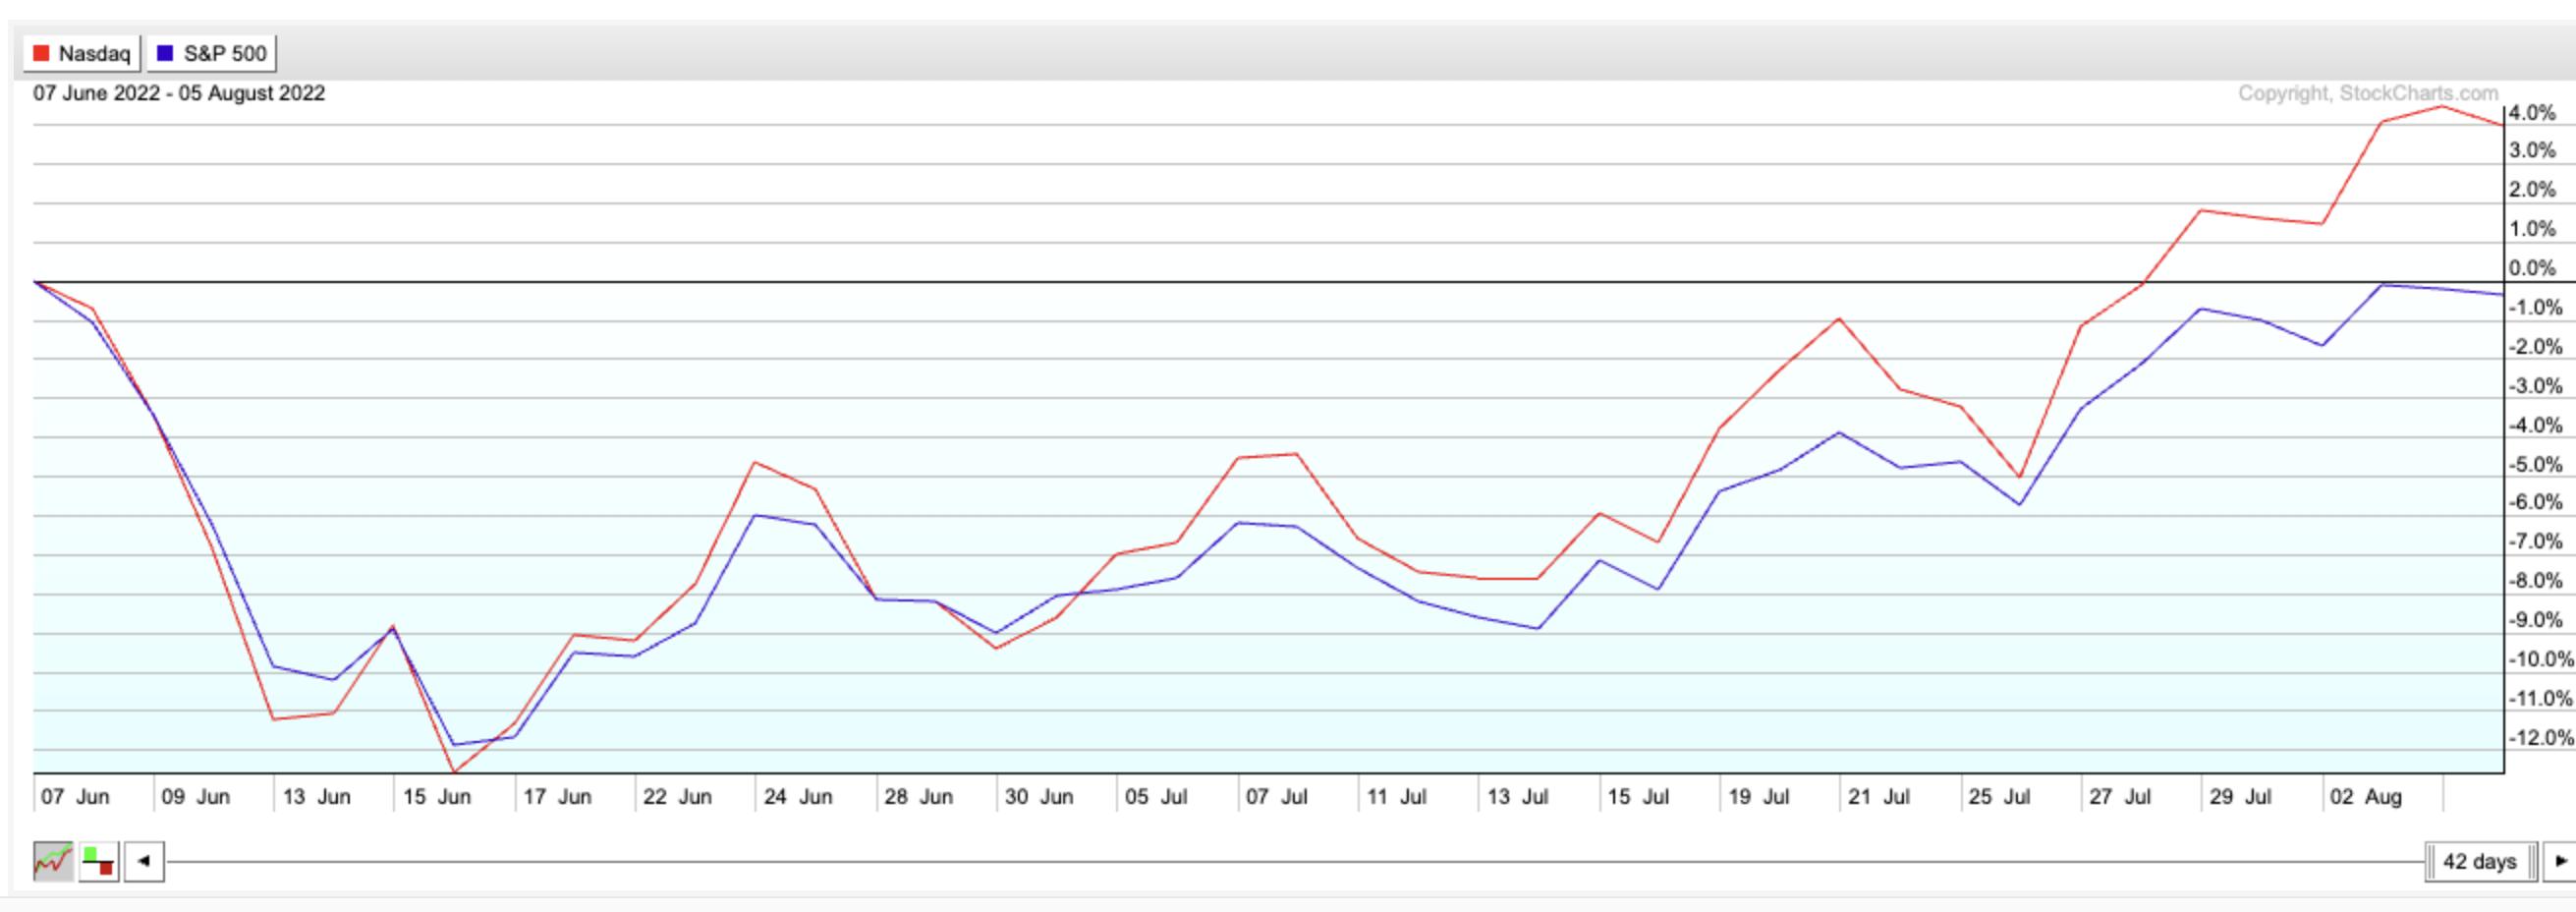
The bull market in stocks carried on last week, despite warnings from several Federal Reserve governors that the central bank is nowhere near being done cracking down on inflation. Growth stocks, in particular, continued their run, with the tech-heavy Nasdaq posting a 14.4% rally over the past 5 weeks compared to the S&P 500’s 9.4% gain.
Nasdaq (red line) vs S&P 500 (blue line) Over Past 2 Months
In addition to investors’ vote of confidence that the Fed may be able to tame inflation without crushing the economy, strong earnings reports from select Technology and Biotech stocks has helped fuel buying in Nasdaq names. Software stocks were some of the biggest gainers last week, with beaten-down names such as software provider Atlassian (TEAM) gapping up 18% after reporting quarterly results that were above estimates, while guiding growth estimates higher going into the 3rd quarter. Servicenow Inc. (NOW) was another winner, after posting 11% on the heels of predicting strong growth prospects going into the remainder of the year.
Both top performing Software companies have several things in common, including being well off their peaks in price from late November of last year. Their declines occurred amid a rise in inflation that impacted all Growth stocks, and it occurred despite NOW and TEAM posting subsequent quarters of growth earlier this year.
Going forward, both companies are citing their continued growth in subscribership, which has them set up to ride the currently turbulent economic environment. Whether these growth prospects can overcome a rising interest rate environment remains to be seen, however, and, below, we review the near- and longer-term prospects for these companies.
DAILY CHART OF ATLASSIAN CORP. (TEAM)
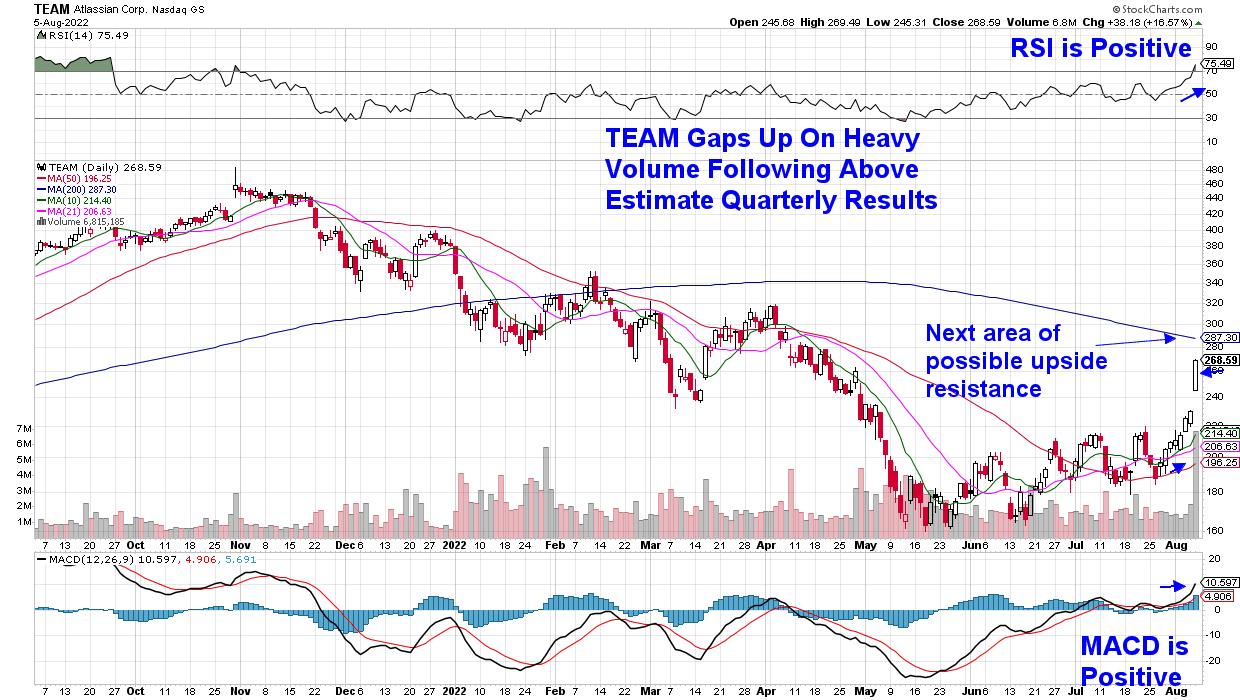
Today’s gap up in price in TEAM occurred on volume that was 277% above estimates, which indicates strong accumulation and often leads to further near-term upside. The stock is closing in on its 200-day moving average, however, which is the next area of upside resistance and is 6.5% away. The good news is that the MACD and RSI are both positive, and I’d be on the lookout for further gains next week and beyond — market permitting.
WEEKLY CHART OF SERVICENOW (NOW)
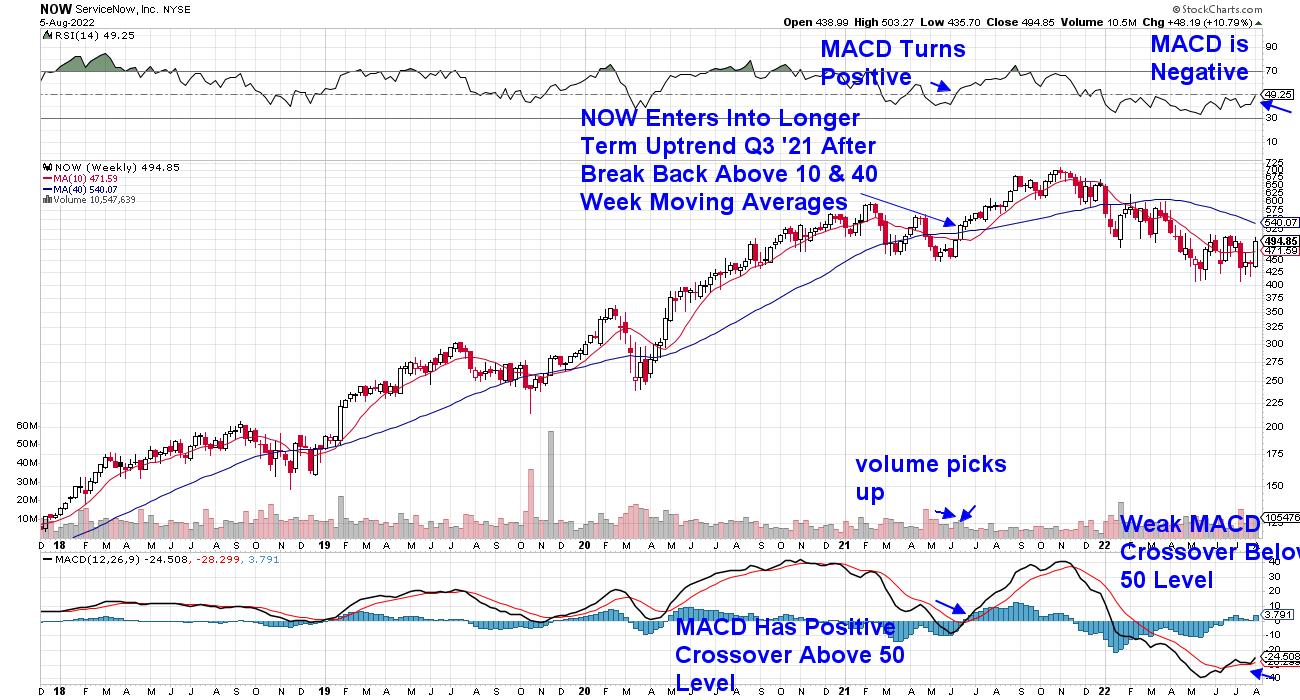
For a longer-term perspective, I’m sharing a weekly chart of ServiceNow (NOW) and, as highlighted, both the RSI and MACD are in negative territory. If we use July 2021 as precedent, NOW has more work to do before embarking on a longer-term rally. A move above its 10- and 40-week moving average would change that outlook, however; particularly if coupled with a positive RSI and MACD crossover similar to July. With most stocks, the health or weakness of its Industry Group and Sector will also play a key role, as almost 50% of a stock’s price movement is attributable to its industry.
Other areas of Growth are also on the move and, if you use this link here, you can access a 2-week trial of my twice weekly MEM Edge Report for a nominal fee to receive a list of select stocks that are in strong buy zones. You’ll also be provided with in-depth insights into the markets, as well as sector rotation currently taking place.
Staying on top of the markets and being aware of when this current rally runs into headwinds will provide you a peace of mind. Use the link above to sign up for a trial today!
On this week’s edition of The MEM Edge, now available to watch on demand at StockChartsTV.com and the StockCharts YouTube channel, I review areas of growth and shares why they remain in a leadership position. I also reveals a more risky area of the markets that is on the move higher, and how to trade stocks after they gap up in volume.
Warmly,
Mary Ellen McGonagle, MEM Investment Research