
When I brought up the Relative Rotation Graph showing the NYFANG components against $SPX I made a few interesting observations.
In general, the rotation of almost all tails looks horrible. They are either already inside the lagging quadrant, (and) at a negative RRG-Heading, or rotating back to lagging. The two exceptions are TSLA which is inside improving and at a strong heading and TSLA which is inside lagging but also at a strong heading.
However, when I inspect both of their price charts, I still see a lot of risks.
The tails on BABA and BIDU are now strongly rotating back down to the lagging quadrant which completely confirms their weak price charts.
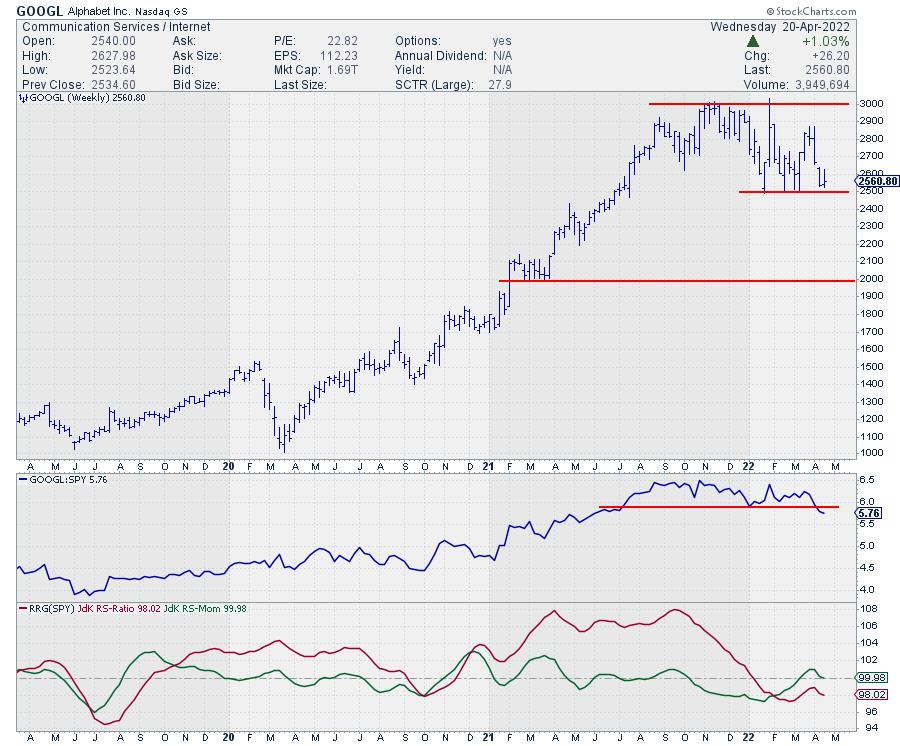
The tail that I want to focus on for this article is GOOGL (Alphabet).
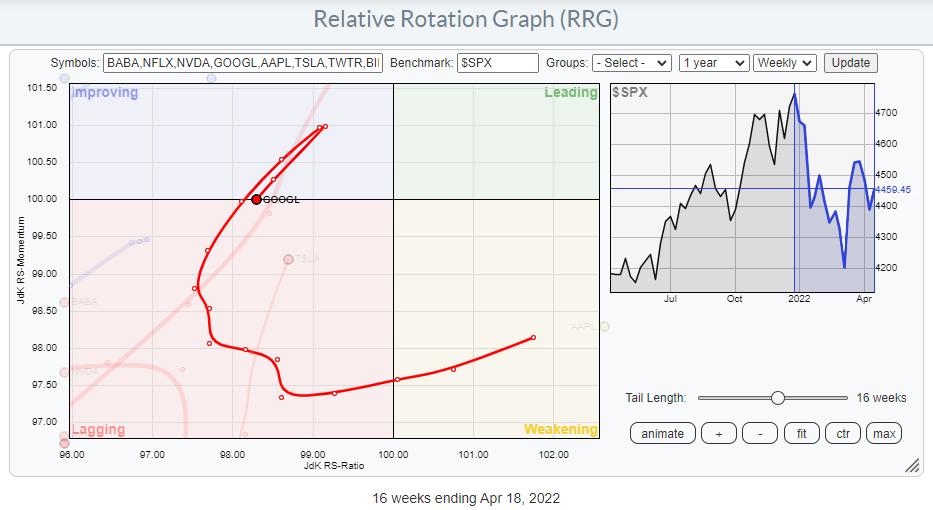
As you can see on the blown-up RRG, GOOGL made a sharp hook back down to lagging after briefly traveling through improving.
Usually, that is not a good sign. And when I look at the price chart I think this time is no different.
Since the start of this year, GOOGL already tested support near 2500, three times already and is close to a fourth.
Relative strength has just broken its floor and is likely to accelerate lower.
Breaking that 2500 support level on the weekly chart, ie we need to see a Friday close (well) below 2500, will be a significant deterioration for this chart and likely cause an acceleration lower in price as well.
Based on the height of the pattern (range between 2500-3000) a target price can be pegged around 2000.
My regular blog is the RRG Charts blog. If you would like to receive a notification when a new article is published there, “Subscribe” with your email address.