Thanksgiving is celebrated here in the US on the 4th Thursday of November and is a day to give thanks. Let me say that I’m very thankful for God and family. I was blessed with my first grandchild a little over a year ago and she’s absolutely beautiful. I’ve never felt a love like the one I have for my granddaughter. If you have grandchildren, I know you can relate.
We all need to keep the stock market in perspective. It’s just the stock market. Still, as it relates to the stock market, I have much to be thankful for as well.
StockCharts.com
It’s actually quite funny how my relationship with StockCharts.com began. I was doing national radio with my partner John Hopkins and I kept saying things like, “let’s take a look at Apple (AAPL) over at StockCharts.com.” So I thought to myself, “we’re giving StockCharts.com a lot of air time. Maybe, just maybe, they’d like to sponsor our show and help offset the expense?” It was a polite NO from Chip Anderson, BUT I started writing on the ChartWatchers newsletter shortly thereafter in September 2006 (crazy that it’s been 15 years already – where does the time go?), and the legendary technical analyst John Murphy joined us live on our radio show. Mind you, I was and still am a HUGE John Murphy fan. I always use the analogy of being a college basketball player and being drafted by the Chicago Bulls to play alongside all-time great Michael Jordan. That’s what it felt like to me interviewing John on my show and then writing with him on the ChartWatchers newsletter. What a great start to a great relationship with StockCharts.com!
This isn’t just a business relationship for me, though. Many of my best friends work at StockCharts.com. The work that takes place “behind the scenes” is absolutely amazing. Teaming up with this extraordinary group of people has probably been the best business decision of my life. Thanks to everyone at StockCharts.com, I am grateful for all you!
John Murphy
I consider myself a self-taught technician. I love analyzing anything financial-related. I like to dig deep. It’s the reason I started my career in public accounting as I was fascinated to see what made businesses “tick.” Numbers and charts are my love languages. I’m naturally curious when it comes to the “hows and whys” of the stock market. Who else in their right mind would have an Excel spreadsheet with every day’s close on the Dow Jones, S&P 500 since 1950 and the NASDAQ since 1971? But we’re all inspired from time to time to be better versions of ourselves and my business inspiration, in large part, came from John Murphy. I’m not a big reader, but I read John’s books and they’ve played a major role in my development as a technician. When I’m asked what book I’d recommend to help learn technical analysis and the stock market, I don’t hesitate. Go to the online store here at StockCharts.com and pick up your copy of John’s “Technical Analysis of the Financial Markets.” It’s well worth the read and it may change the course of your financial future or someone close to you, as it did mine. While John’s teaching was invaluable to me, I’m most thankful for the inspiration it provided me. I now look under every stock market leaf trying to find the stock market’s next clue. In particular, John’s intermarket relationships provided the foundation for much of my stock market guidance, research, and education.
I first met John in 2011 at the very first ChartCon in Seattle. After years of admiring his work, he then became a great friend. Thank you John!
Secular Bull Market
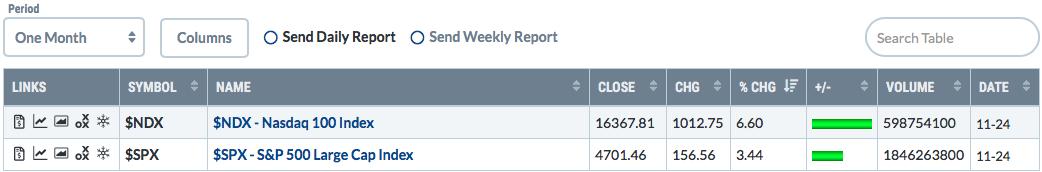
Yes, I’m thankful for this raging bull market. It’s helping millions of folks around the globe achieve their financial goals and dreams. The best news, in my opinion, is that this long-term bull market hasn’t yet run its course. While the financial media tries to rip the market apart at every turn, it just keeps rolling higher and higher. Skeptics have pointed to quantitative easing (QE), the trade war, the COVID-19 pandemic, the national debt, etc. as reasons why the stock market cannot go higher. Yet we keep going higher. The latest reason is inflation that’s spiraling out of control. But the growth-oriented NASDAQ 100 ($NDX) is leading the S&P 500 ($SPX) over every time frame in 2021 – year-to-date, last 6 months, last 3 months, last month, etc. Inflation KILLS growth stocks and Wall Street looks ahead 6 to 9 months. If the brilliant MBAs on Wall Street believe inflation will be problematic in the months ahead, you’d see it in the relative performance of these two key indices. However, during the stock market’s crazy rise over the past month, here’s your relative performance:
Growth stocks are leading. This isn’t me making “click-bait” headlines. This is indisputable fact. You see, the charts tell us the TRUTH about stock market behavior. It doesn’t get caught up in “what ifs.” It’s why technical analysis is so incredibly important. Here’s a price-relative chart to drive home my point:
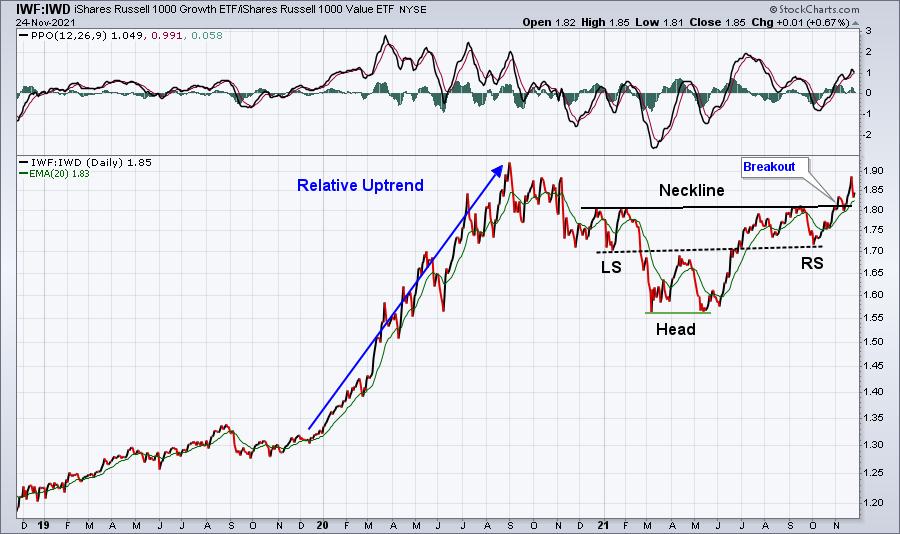
When inflationary reports began coming in much hotter than expected in February, you can see that growth stocks (IWF) tumbled vs. its value-stock (IWD) counterparts. That significant relative downtrend took place from February to May and it’s undeniable. Growth stocks were crushed. But the ensuing relative inverse head & shoulders pattern was quite bullish and we just broke out above the relative neckline earlier this month. In other words, growth stocks have now outperformed value stocks since February throughout all the economic imbalances and elevated inflationary readings. What does this tell us? Well, it tells me that Wall Street used the selling in the Spring to accumulate growth stocks. Hey, you don’t have to believe me. Again, let’s let the charts do the talking:
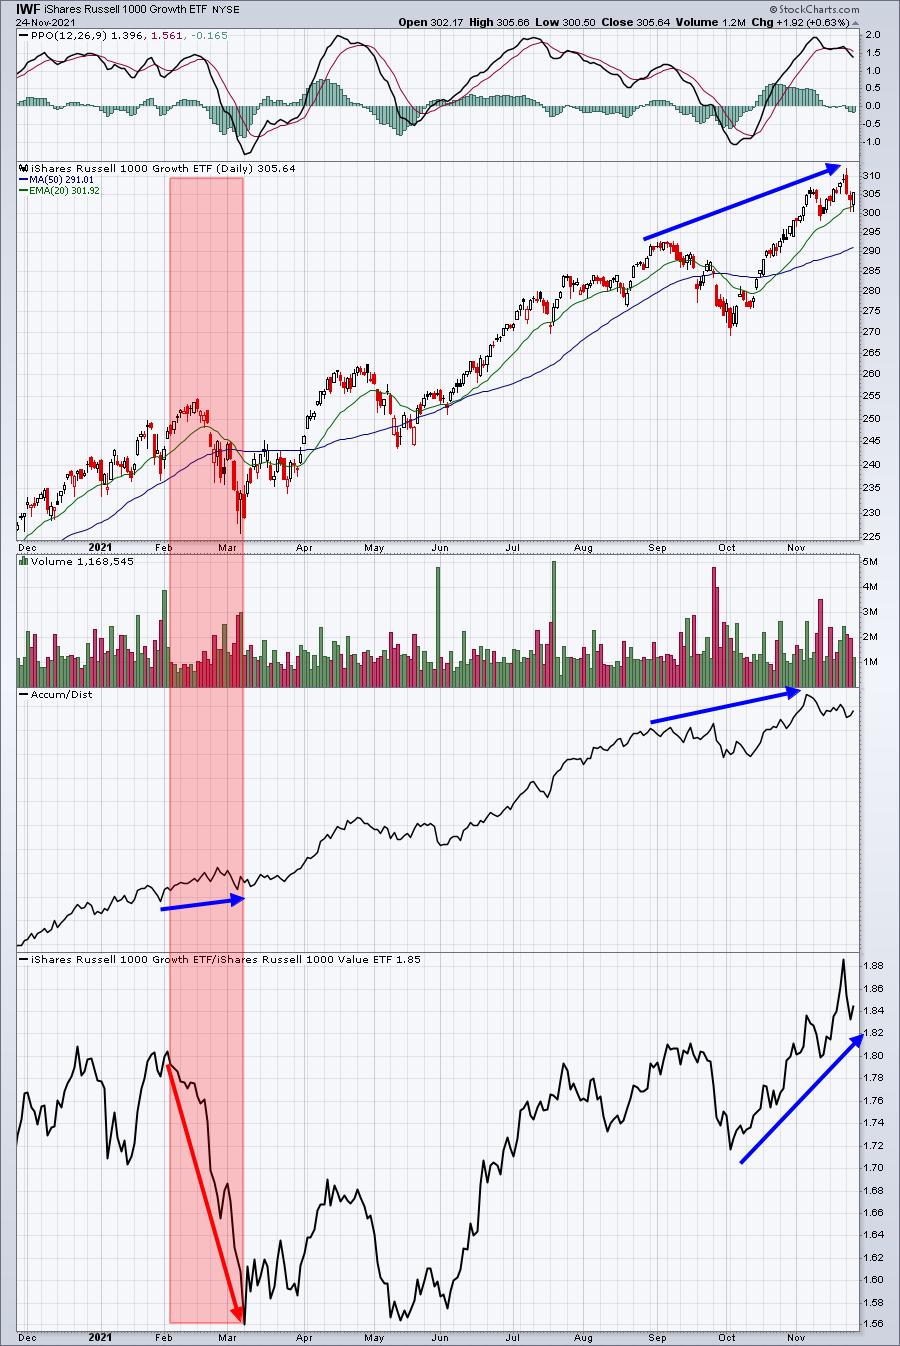
The IWF’s AD line rose during February as it appeared to be falling out of favor. I believe it’s important to note that the AD line has been rising throughout the year, including over the past 7 weeks or so as clear rotation has taken place back to growth stocks.
Now let’s look at the IWD to see how value stocks performed on the same chart and timeline:
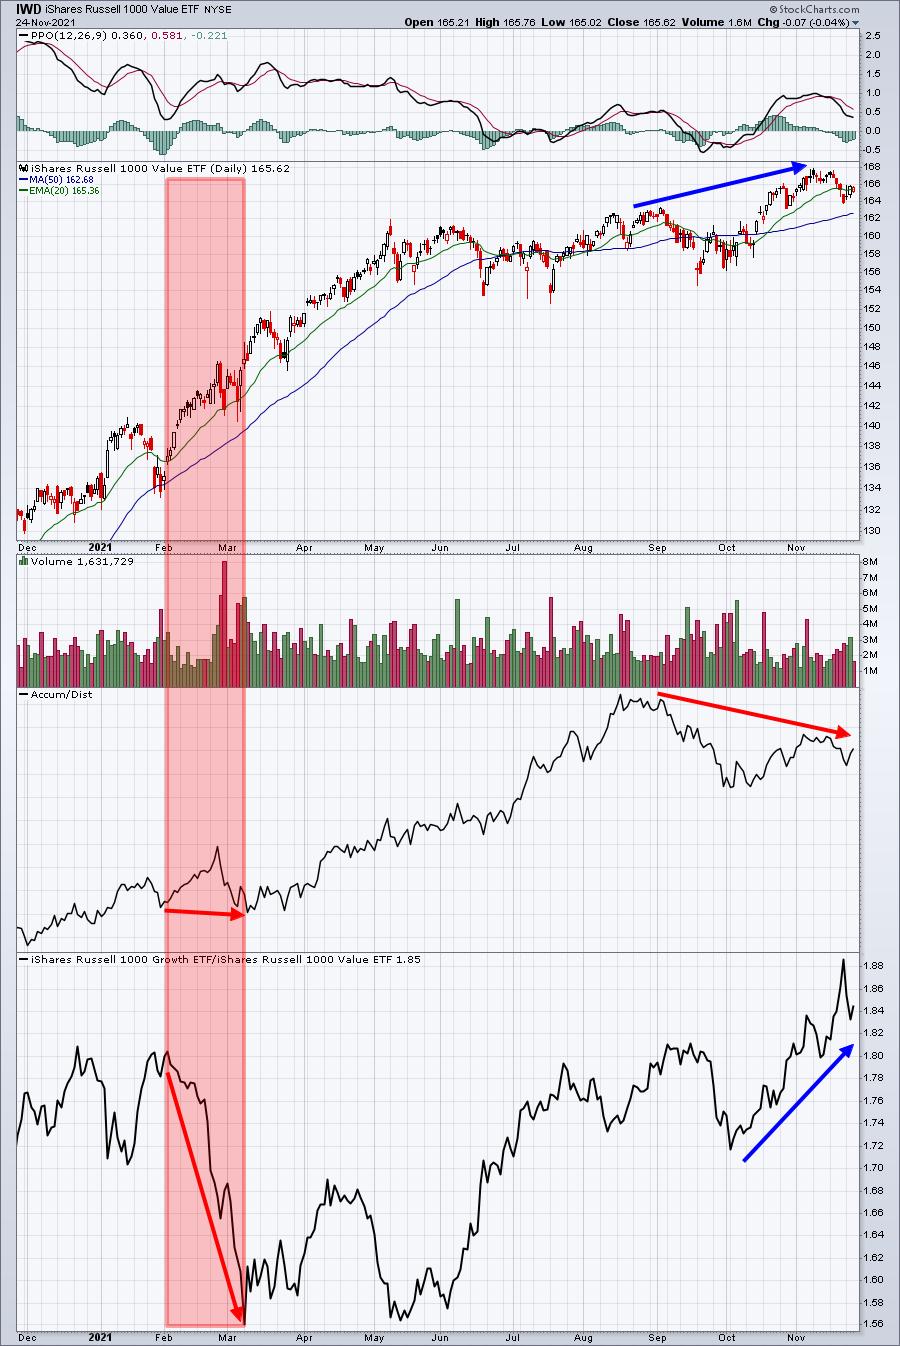
The IWD AD line actually declined during February when it was supposedly being accumulated vs. growth stocks. Interesting. Over the past several weeks, the IWD has broken out on an absolute basis, but it’s been steadily losing ground vs. growth stocks. And its AD line? It hasn’t confirmed the breakout in price.
So the media can hype up inflation all it wants, but as long as Wall Street keeps sending me signals that inflation is not a problem, I will listen to the money and ignore the “click-bait” headlines. In my humble opinion, the media is a pawn for Wall Street. It helps to create the panic and volatility from time to time in order to allow big Wall Street firms the opportunity to accumulate at our expense.
You have a choice. You can listen to the headlines that constantly scream the sky is falling or you can benefit from all the great tools and features here at StockCharts.com to be your own finance MBA.
Thank you secular bull market!
My Colleagues
It always helps to be challenged. StockCharts.com has assembled many of the finest technical analysts around. I would much rather try to objectively assess the technical merits of these blog authors, show hosts, and great friends, than to try to assess the agenda of the media. It’s usually most helpful when my colleagues disagree with my technical assessment as it provides another objective opinion about what’s taking place on the charts and in the market. I might disagree with their assessment as the stock market always has two sides, but it definitely provides food for thought. And, quite honestly, we all have our own biases that Dave Keller often speaks of, so stepping back to consider another opinion is invaluable.
Thank you to my colleagues for all your tireless work to enable the StockCharts.com audience to make more informed investing and trading decisions!
The Community
The StockCharts.com platform has provided me the opportunity to reach millions of folks around the globe. While I always joke that the only market guarantee I can make is that I’m going to be wrong plenty of times, the truth is that trading and investing can be a very lonely business/hobby. It’s a scary thing to invest for the future, because there are so many possible directions to go and none of us have a crystal ball. My work and the work of others here would all be for naught, however, if it weren’t for the entire StockCharts.com community of fellow investors/traders. We appreciate you!
When I returned to EarningsBeats.com in September 2019, I never could have imagined the level of support I’d receive. It was a no-brainer decision for me to return to my “roots” as EB’s Chief Market Strategist, while also providing me the opportunity to work with my daughter Erin Webber, a fellow CPA. This community support has enabled me to reach dreams that I didn’t even know were possible. Whether you’ve listened to my Trading Places shows, read my blog articles in ChartWatchers, Trading Places, and Don’t Ignore This Chart, subscribed to our EB Digest free newsletter, or become a paid member at EarningsBeats.com, you’ve played a part in my success and the success of EarningsBeats.com. For that, I’d like to say thank you!
Looking Ahead
The past is the past and we can’t change any of it – whether we’d like to or not. But the future is not certain or settled. We will play a starring role in our financial future. I’m certainly an optimist when it comes to the stock market as history tells us that stock prices rise much more often than they decline. Also, history suggests that we’re still in the early to middle stages of a bullish super cycle. The big picture says that we’re in a multi-decade period that favors the equity market. Check this out as pictures do literally say a thousand words:
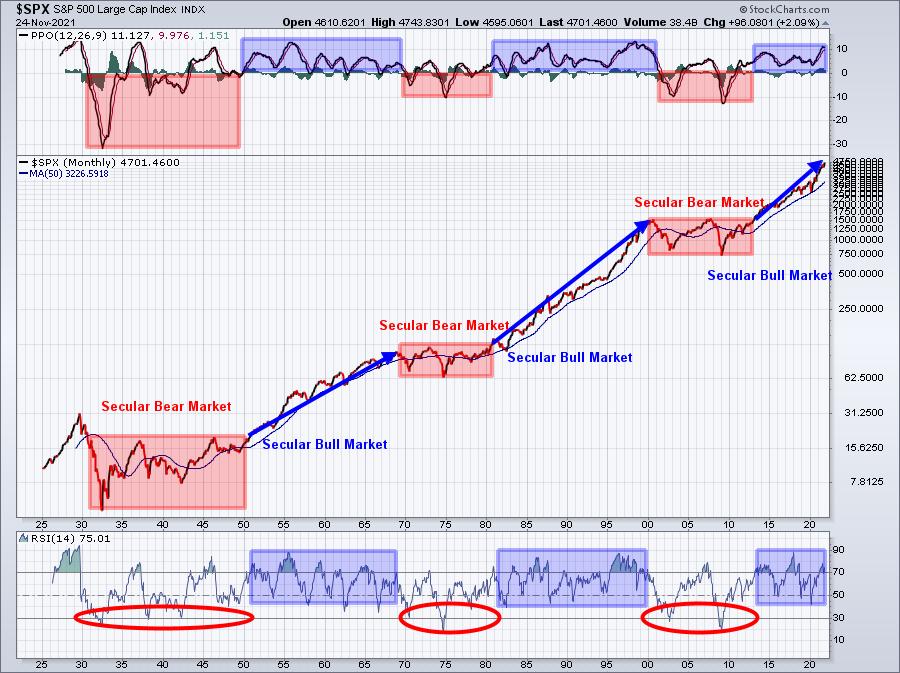
While many incorrectly try to call major long-term market tops using daily charts, media headlines, and/or preconceived biases, these types of major market reversals are best seen and confirmed on long-term monthly charts. Secular bear markets have never occurred without 2 technical conditions present simultaneously. First, the monthly PPO MUST see a bearish centerline crossover AND the monthly RSI must pierce 40 support. While these signals will not occur at a market top, they do alert us to the fact that we’ll be in for YEARS of frustration. These signals absolutely should be viewed as bearish technical confirmation and investing/trading strategies should be adjusted accordingly. Fortunately, we’re potentially in Year 8 of this secular bull market. I consider the start of a secular bull market to be the time that we clear previous tops. In the case of the current secular bull market, it occurred on April 10, 2013. Previous secular bull markets have spanned up to two decades, which would take us to 2033. That means we could very well be in Year 8 of 20 of a major market advance. Before you think I’m totally nuts, you need to realize that cyclical bear markets can occur during secular bull markets. We’ve already had two – one during Q4 2018 (trade war) and Q1 2020 (COVID-19 pandemic) – during the current secular bull market. I’m not at all suggesting that we’ll go straight up for the next 12 years. I believe the secular bull market in the 1950s and 1960s saw multiple recessions and cyclical bear markets.
Based on history, however, I believe the next dozen years will be incredibly important in building wealth through equities as the subsequent secular bear market will most likely produce a shift into other asset classes and be much, much more challenging.
Our Commitment
As always, I’ll try to objectively review the charts and continue to provide you with the latest technical information. History provides us many lessons, but history also continues to evolve. We have to evolve with it as best we can. Changing market conditions require us to change strategies as well from time to time.
While stock market guidance, research, and education are the three “pillars” of our service at EarningsBeats.com, I’ve always been most consumed by the educational aspect. I spent a lot of “stock market tuition” over the past 35-40 years. We all want to make a difference, hopefully positive, in helping others. I do my best to pass on everything I’ve learned over the years (and continue to learn) to help others avoid many of the mistakes I’ve made. I sincerely hope that something I’ve written or said has had a positive impact on you somewhere along the way.
I want to thank you for your support over the years. Many of our members have been with us since 2004, the year we started our business. It’s really unbelievable to think that members have been with us through all of our business iterations. If you’d like to become part of our EarningsBeats.com community, here are two ways to do so:
Free EB Digest newsletter, published 3x per week (M-W-F, no credit card required)
Register with your name and email address HERE.
30-day FREE trial to our paid service (credit card required)
CLICK HERE to learn more and get your free trial started!
Our best deal ever – our Fall Special – is running through this Saturday, so this is a GREAT time to try us initially for FREE!
Whatever support you’ve given us in the past, I want to sincerely thank you! We’re looking forward to a bright future ahead!
Happy Thanksgiving and Happy Trading!
Tom