A brief excerpt:
This is the final look at local markets in May. I’m tracking about 35 local housing markets in the US. Some of the 35 markets are states, and some are metropolitan areas. I update these tables throughout each month as additional data is released.
We are seeing a significant change in inventory, and maybe a pickup in new listings. So far, most of the increase in inventory has been due to softer demand – likely because of higher mortgage rates – but we need to keep an eye on new listings too.
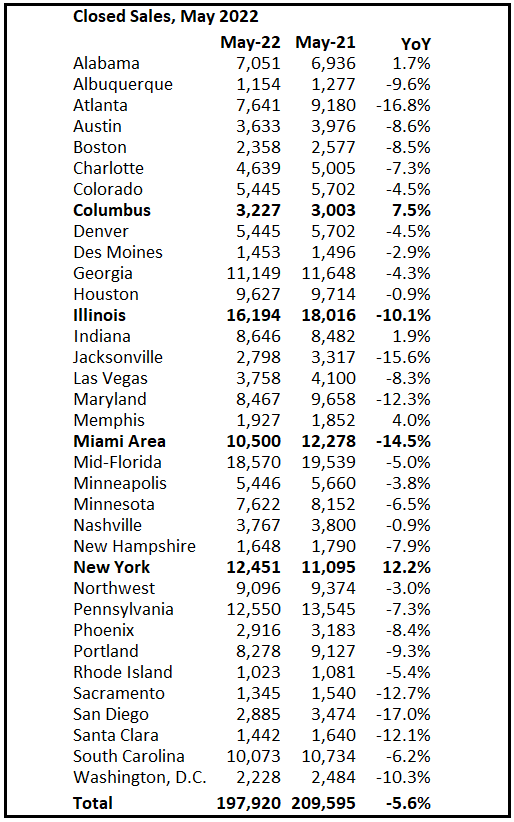
…And a table of May sales. Sales in these areas were down 5.6% YoY, Not Seasonally Adjusted (NSA). The NAR reported sales NSA in May (498,000) were 5.7% below sales in May 2021 (528,000). So, this sample of local markets is similar to the NAR report.
The table doesn’t include California where sales were down 15.2% year-over-year.
There is much more in the article. You can subscribe at https://calculatedrisk.substack.com/