A brief excerpt:
The big story for August existing home sales was the sharp year-over-year (YoY) decline in sales. Another key story was that new listings were down YoY in August as the sellers’ strike continued. And active listings were up. Also, median prices are falling nationally (more than normal seasonally).
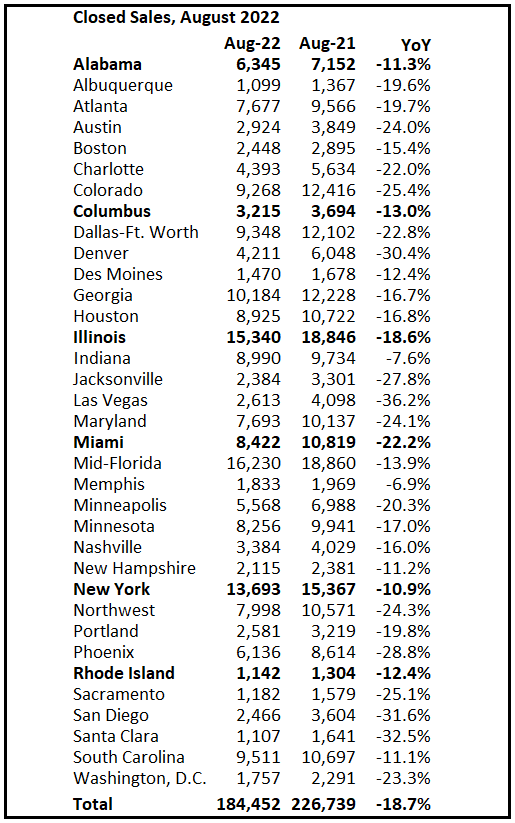
This is the final look at local markets in August. I’m tracking about 35 local housing markets in the US. Some of the 35 markets are states, and some are metropolitan areas. I update these tables throughout the month as additional data is released.
…And a table of August sales. In August, sales in these markets were down 18.7% YoY. The NAR reported sales were down 17.4% NSA YoY. Contracts for sales in August were mostly signed in June and July, and we are seeing the impact of higher mortgage rates on August closings.
…
Looking ahead: In September 2022, there were the same number of working days as in September 2021, so the SA and NSA declines in sales will be similar.
There is much more in the article. You can subscribe at https://calculatedrisk.substack.com/