Communication is key…
The Communication Services started to come alive again after a dull period, at least in relative terms.
Recently I wrote about the sector here in a DITC article : Is everybody calling and texting or what? Also in the first Sector Spotlight show of this month (May), XLC showed up as a potentially strong candidate from a seasonality perspective in combination with a promising rotation on the Relative Rotation Graph.
Sector Level
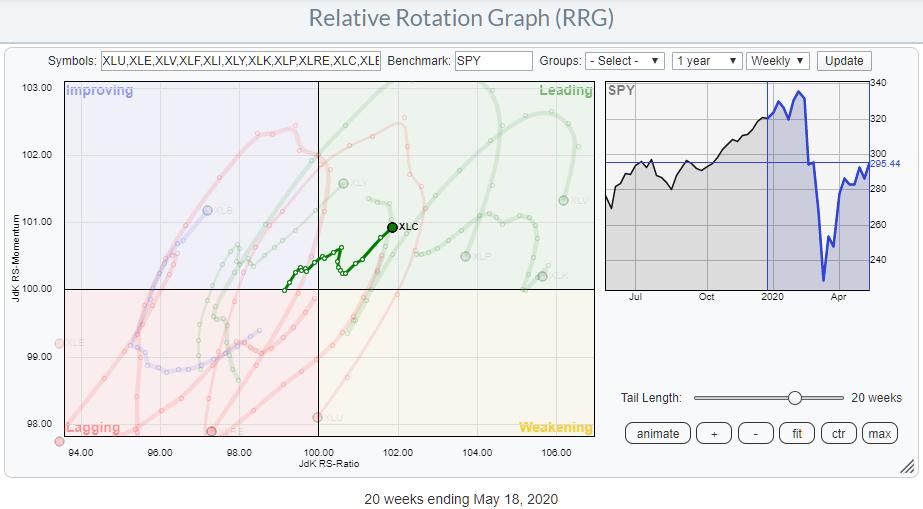
After having spent some time in vicinity of the benchmark, XLC started to move away and into the lagging quadrant at a strong RRG-Heading. At the moment it is one of the stronger/leading sectors inside the S&P 500.
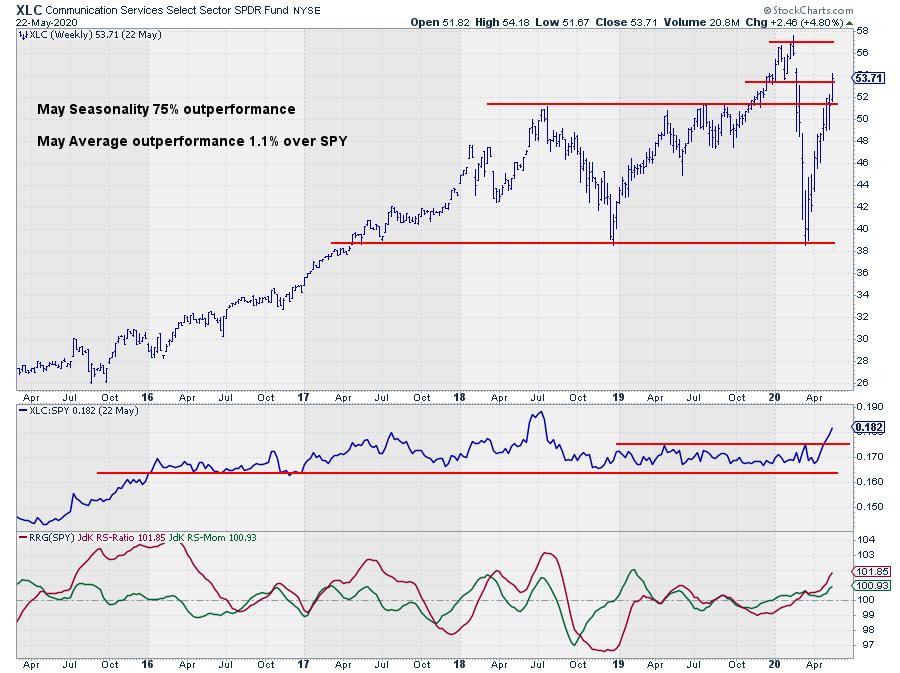
On the price chart, XLC dropped back to support at the December-2018 low, almost to the penny, and jumped off that support level like a trampoline. In, nearly, a straight line the sector recovered from levels around $39, to currently around $54 while breaking through horizontal barriers as if they did not exist.
All this price power has led to a substantial improvement in relative strength.
Since the start of 2019, or the start of 2016 if you want to be a little less narrow, XLC traded in a tight range. This narrow range caused XLC to remain close to the benchmark on the RRG. The rapid improvement in price has now led to an upward break out of that range in relative strength and this puts the sector inside the leading quadrant at a strong RRG-Heading.
Reason enough to take a look at the rotation of individual stocks inside this sector.
Individual Stocks
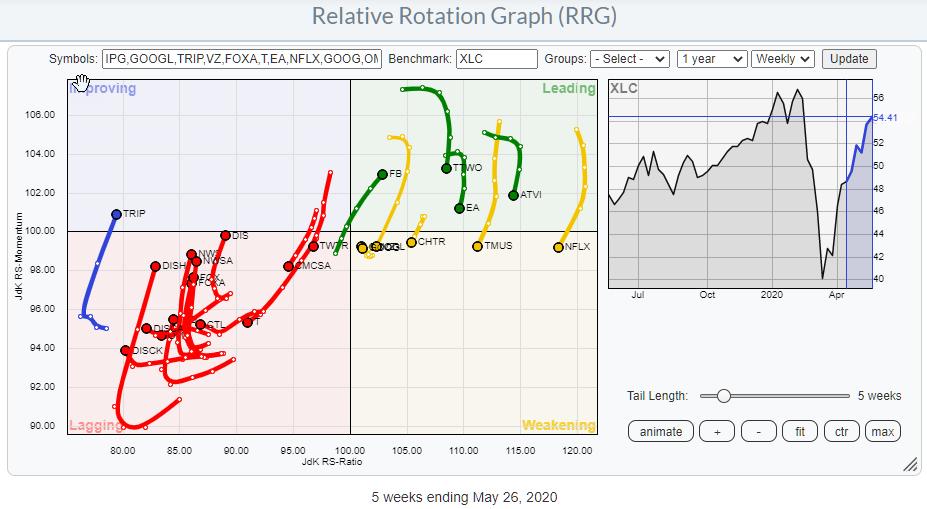
Here is the RRG showing the rotation of its members around XLC as the benchmark.
One name that immediately stands out is FB which is shooting through the center (benchmark) almost straight into the leading quadrant at a strong RRG heading.
Also the high RS Ratio reading for NFLX draws the attention. Zooming in* shows that both GOOG and GOOGL are inside weakening, close to the benchmark and curling up again, back towards the leading quadrant.
*Open up the live RRG chart by clicking on the image and use the + and – buttons to zoom in on the area around the benchmark.
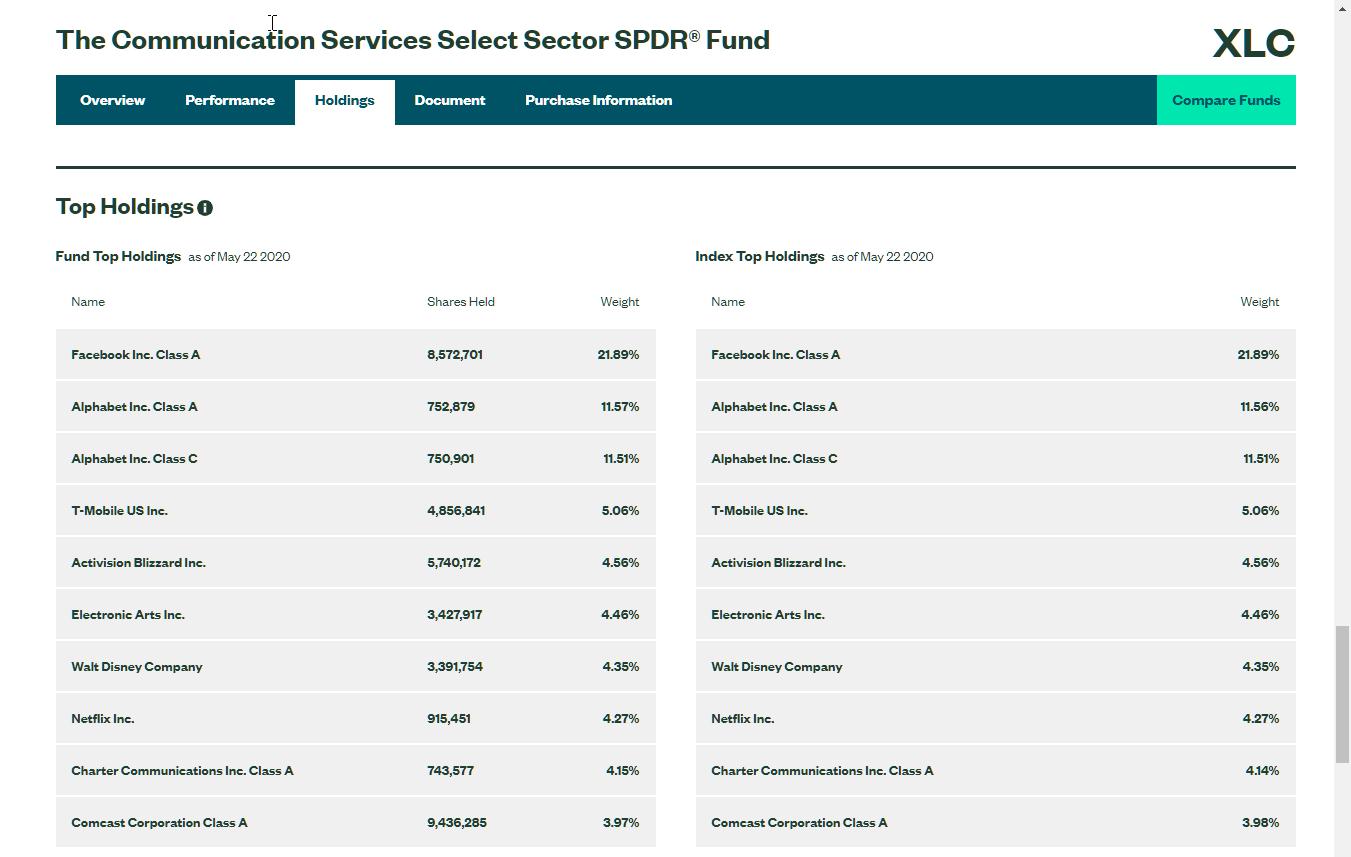
I don’t know the exact weights for these stocks but I do know they are important and heavyweights. To check the numbers I open up the page for XLC on the SPDRS.COM website.
This shows that FB is the heaviest symbol in the index at almost 22% but GOOGLE is a bit in disguise as it has two symbols present in this universe, GOOG and GOOGL. Alphabet class A and class C. And together they represent 23% of XLC.
Ao together Facebook and Google, make up 45% of XLC… From an investors point of view this means that you basically have to get FB and GOOG(L) right to get the sector right…
A quick way to dive in the various segments (industry groups) of the sector is to rank the table below the RRG on the column “industry”
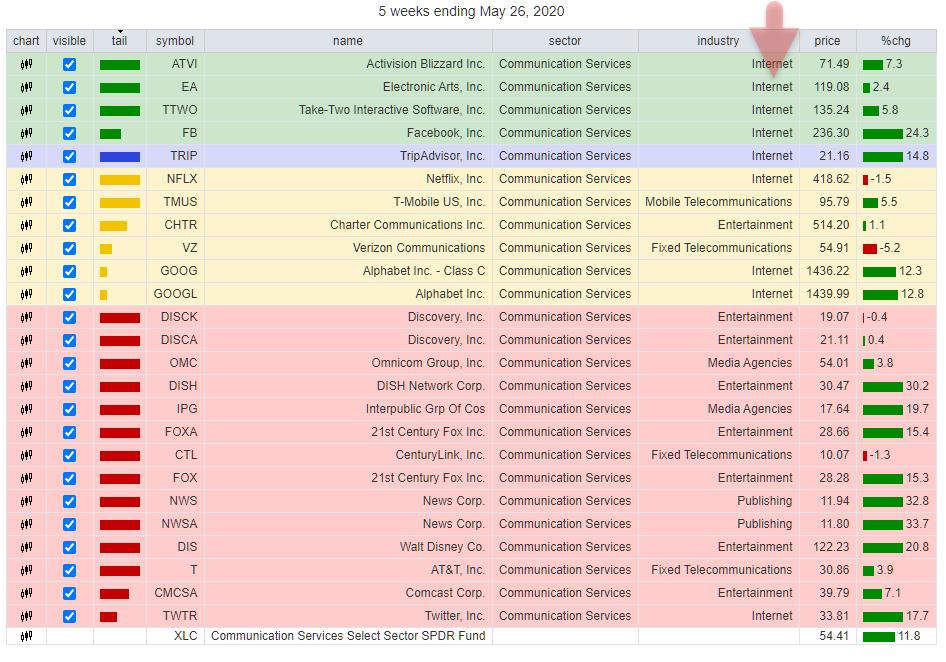
This reveals that, without a doubt, the “internet” industry group is driving the performance of the sector.
FB
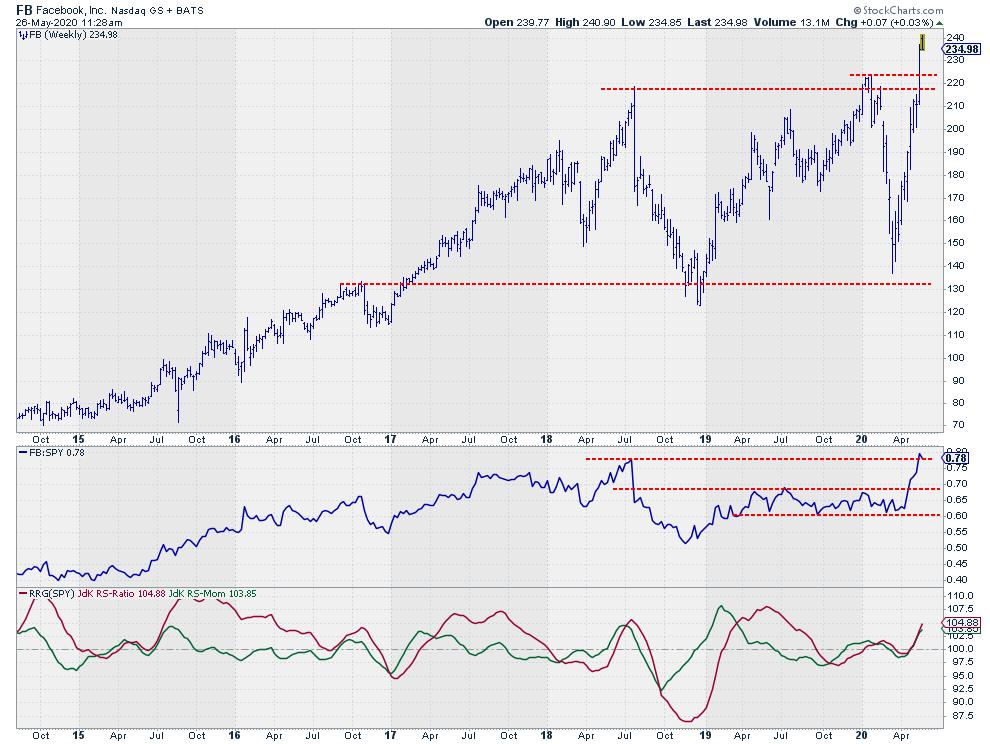
Solidly at hew highs in the price chart, FB is without a doubt one of the strongest stocks inside XLC but also inside the S&P 500. The upward break has reversed the risk/reward ratio in favor of long positions, again. As support is now found in the area around $220 while upside is uncharted.
If this chart would be presented at a CMT, or other, Technical Analysis examination with the request to come up with a price target. The correct answer would be to take the height of the previous range, $ 150 (conservatively) to $220 = $70 and add that to the breakout level (@220), which comes out at $290.
It may sound a bit far fetched given the current uncertainty in the markets but forget trying to “make sense” of the markets and just looking at the message that this chart is sending, that’s what it is!! $290.
GOOGL
The other big one in the sector, at least combined, is Google. The A and C shares trade a marginal difference that is so small that there is little or no impact on the technical picture. So I have picked GOOGL (A-shares) for this purpose, at least they give you voting rights if you ever wanted to attend a Google shareholders meeting 😉
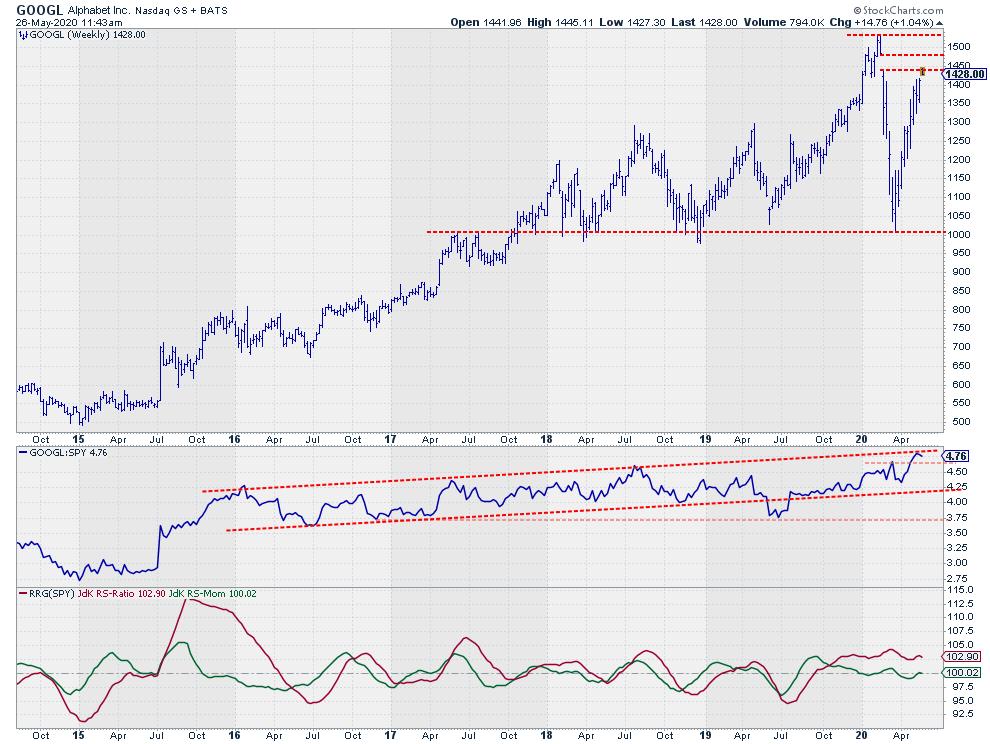
The drop in March found support just above $1000, a level which came into play a few times in the past already. First as resistance in 2017, and after the break in that same year, multiple times as support. Lastly in the week of 23 March.
Just like FB, the rally out of that low is nothing short of impressive but that is where the comparison stops. GOOGL is now challenging a resistance area that is offered by the gap area between $1440-$1480. This means that further upside for GOOGL is facing a bit more barriers than FB.
From a relative strength pov it depends a little on how you draw your lines whether there is a break or not. Simply looking at previous highs and lows then yes, GOOGL just broke to new relative highs. If you dra a rising resistance line from the early 2016 peak, you get a trendline that has three prior touch-points and is now tested by GOOGL. A break beyond that gradually rising resistance in RS will defintely help a further improvement of the rotation on the RRG and take the stock back into the leading quadrant.
Which scenario will play out remains to be seen but if GOOGL maneges to hold up and does not dramatically collapse, the XLC sector will very likely remain in good health and driven higher by, primarily FB.
What to Avoid?
The weakest rotations in the sector are found inside the lagging quadrant where AT&T (T), Comcast Corp. (CMCSA), and Twitter (TWTR) all have rotated back down into the lagging quadrant after an initial improvement. This means that they have started a new leg down in an already declining relative trend.
TWTR
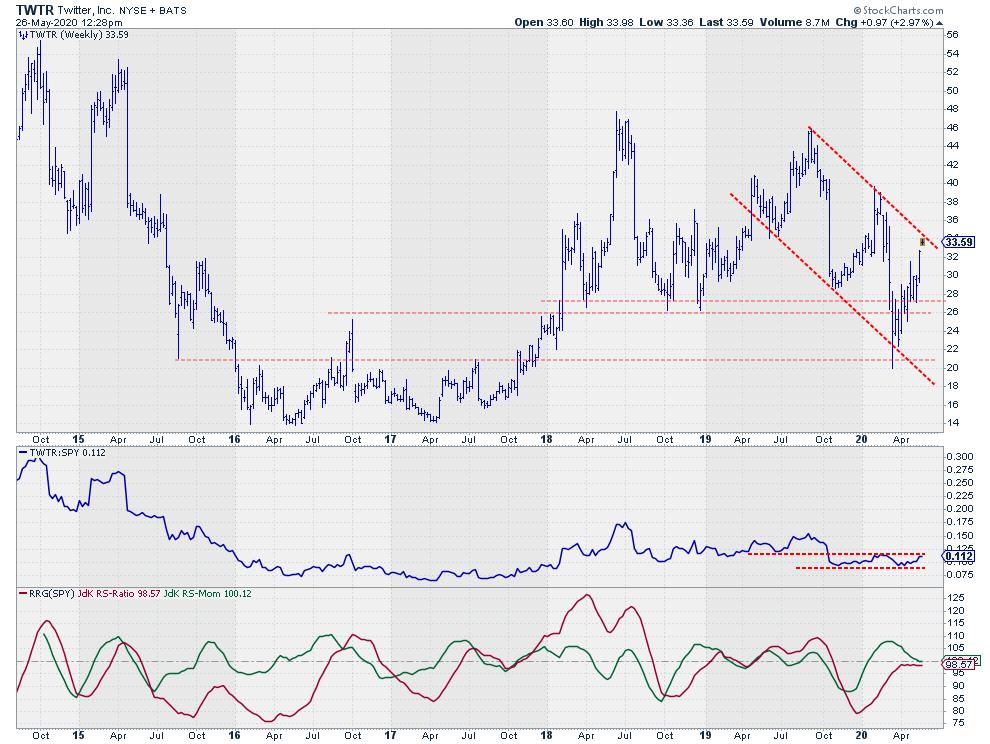
First of all TWTR dropped way below its support area around $26 and needed to go as low as $20 before support was found. The rally out of this support level has not been very impressive so far. TWTR was not able to get back to the peak level that was set earlier this year, let alone the peaks that were seen in 2018 or even 2014 and 2015.
At the moment it looks like a declining channel is developing, especially when TWTR is going to put in a new high at current levels. For sure the downside risk is now substantially bigger than upside potential for TWTR.
#StaySafe, –Julius
