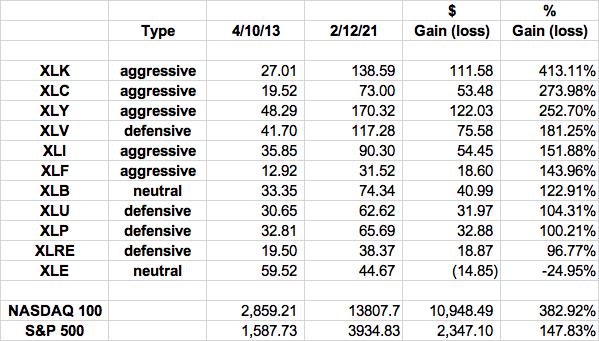
When we go through our quarterly portfolio “draft” at EarningsBeats.com, we take a top down approach. We first evaluate the overall market to determine if we’re bullish, neutral, or bearish. Clearly, we’re bullish. The S&P 500 closed at an all-time high on Friday. I’d be happy to be part of the Bullish Debate Team. When we’re in a bullish market, there’s no doubt I want to own stocks within aggressive sectors – technology (XLK), consumer discretionary (XLY), communication services (XLC), industrials (XLI), and financials (XLF). Since we cleared the double top from 2000 and 2007 in April 2013, these five sectors have dominated the bullish market action, especially those first three. Here are the cumulative sector returns since April 10, 2013, the day that the breakout occurred, confirming the current secular bull market:

The S&P 500 is a nice, steady way of building up your savings, but this very diversified index stunts your growth during a secular bull market. Just take one look at the NASDAQ 100 index over the same period. That difference is over just an 8-year period and could make a massive difference in your financial security. During secular bull market advances, you want to overweight the more aggressive sectors.
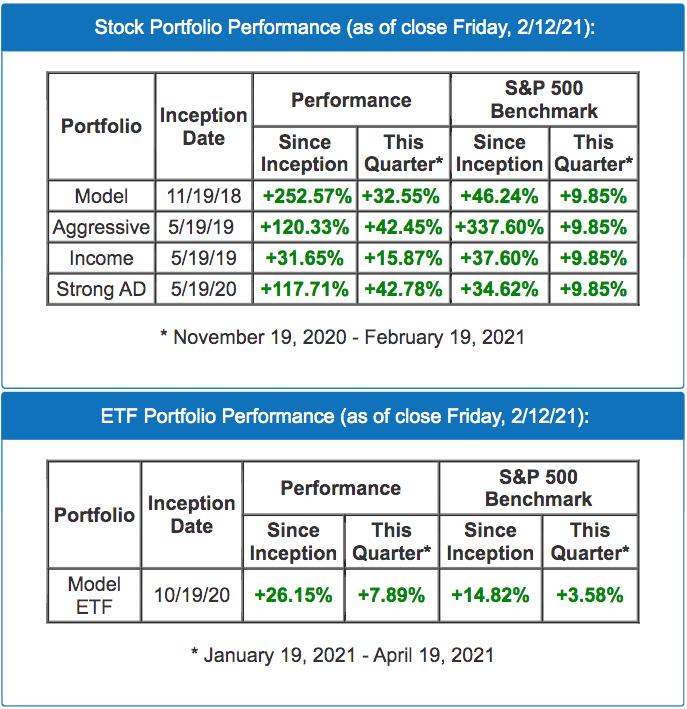
If you want to better understand our portfolio performance (both stock and ETF) and how we significantly outperform the benchmark S&P 500, the above table is just the beginning. Check out our performance (we update our performance daily at EarningsBeats.com):

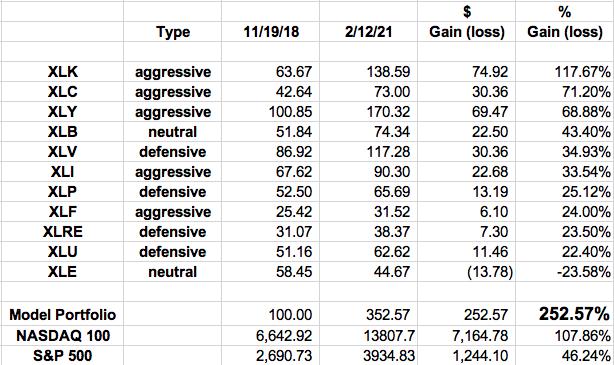
Let’s focus on our Model Portfolio. Using the same table as we did earlier, and adding the Model Portfolio return against the benchmarks, here are the returns since November 19, 2018, the inception date of our Model Portfolio:

There are a few changes here to note. While the top 3 sectors are once again the aggressive sectors, we do see that materials (XLB) have jumped up into the #4 spot. Industrials (XLI) and financials (XLF), two of our aggressive sectors, fell back and underperformed the S&P 500, but the rapidly-declining treasury yields most definitely played a role there, not to mention the pandemic. Just as we saw in the earlier chart, the NASDAQ 100 crushed the S&P 500. But I’ve highlighted our Model Portfolio return, which has crushed every area on this chart. This is the difference when you invest in rotating leaders every quarter like we do at EarningsBeats.com.
What’s the Secret?
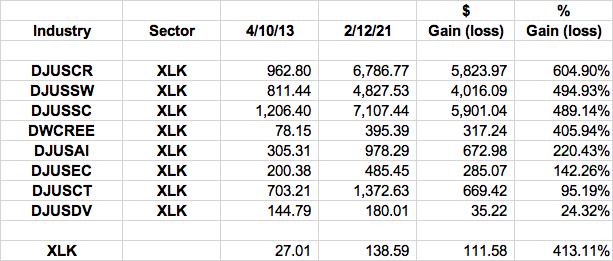
You MUST follow relative strength. More than anything else, PLEASE follow relative strength. Wall Street tells us every single day where they’re investing their billions of dollars. We don’t need their brilliant MBAs. We only need to follow the fundamentals (earnings) and the charts. Above I showed you the breakdown of the various sectors within the S&P 500 and you could clearly see how different sectors yielded different results, right? Well, you can break down sectors into its industry groups to further narrow down that strength. Let’s take technology, the clear sector leader, for example, and dive into its industry group performance since that April 2013 breakout to zero in on the “strength within strength”:

Not all technology industry groups are created equal. The XLK is a nice ETF to invest in during a secular bull market, but zeroing in on computer hardware ($DJUSCR), software ($DJUSSW), and semiconductors ($DJUSSC) has been even better. We currently have one Model Portfolio stock from each of these three industry groups and that’s been a constant theme since 2018. Since the Model Portfolio’s inception on November 19, 2018, we’ve selected 90 stocks (10 each for 9 different quarterly Model portfolios). 26 of them have been in these 3 industry groups. We want to own leading stocks within leading industry groups within leading sectors in a secular bull market. That’s how we achieve financial success with our portfolios. Rather than allow our money to be spread into areas that underperforming, we are constantly putting our money to work in favored areas of the market. The results have been astounding.
The DRAFT
Every quarter we have two DRAFT-related events, one public (open to everyone) and one private (open to members). The former is a “Sneak Preview” event where we discuss our latest portfolio performance, the overall market, our methodology, the key themes to consider for the next quarter, sector/industry relative strength, several stand-out earnings reports (potential portfolio candidates), etc. This one is open to the public (it’s free) and I believe can help anyone to achieve superior returns. Our next Sneak Preview event will be held this Monday, February 15th at 4:30pm ET. If you’d like more information in order to attend, CLICK HERE for details.
The following Sunday evening, February 21st will be what I like to refer to as our DRAFT, where we unveil the Top 10 Stocks for each of our 4 portfolios. Each stock is equal-weighted and will be held for an entire quarter. We do not use stops for our tracking purposes. However, members may do whatever is most comfortable for their own personal situation. These portfolios, in a way, are where “fundamentals meet technicals” and “trading meets buy-and-hold.” We do not trade within these portfolios during the quarter so that these portfolios (and our results) are very simple and completely transparent. If you’d like to be a part of our next DRAFT, you’ll need to be at least a 30-day trial member. We currently offer a no-cost 30-day trial HERE. We’d love to have you join us and be part of our growing community of knowledgeable investors.
Happy trading!
Tom