I remember many years ago, I was fascinated by the fast-moving, low-dollar stocks. It just seemed like easy money. Let me give you one piece of advice. When you think something is “easy money”, run for the hills. To give you a business analogy, those volatile low-dollar stocks are “job hoppers.” You know there’s something wrong, but you hire them anyway. What happens? In the middle of a big project, they leave and head for another employer. I always seemed to have similar results with small stocks. I typically ignored the warning signs and bought them anyway, just knowing that big profits were around the corner. Hello losses!
Instead of “big move potential”, look for the leaders. Let’s go back to that business analogy for a moment. If you’re a business owner, do you think it would be better to hire those possessing tremendous leadership skills (and maybe pay up a little bit) or would you hire underperformers, hoping that they’ll be different when they work for you? After being in business for myself for the better part of 30 years now, I know how I’d answer that question. Why should we treat investing/trading any differently? Do you want excitement or do you want to make money?
The answers to these questions (and more) are truly the inspiration behind all the research that we do at EarningsBeats.com. We “pre-qualify” your stocks for you. Granted, 2022 has been a difficult market to buy much of anything – outside of a very strong energy (XLE) sector. But I firmly believe our (bulls) time is coming. Patience is the key. If you’re a trader, you want to trade. I get it. Ultimately, however, my desire to make money outweighs my desire to simply trade for the sake of trading. This is my livelihood and cash is my product. Preserving that cash during difficult cyclical bear markets is absolutely paramount – above all else. Sure, I try to make money with a trade here or there, but expectations MUST be lowered significantly during a volatile period like the one we’re experiencing. I sleep so much better at night right now when I’m primarily in cash. Overtrading on the long side is the worst strategy possible now, unless again, you’re trading energy stocks. That’s really the only group that’s been working consistently in 2022.
So let’s get back to that research that we do at EarningsBeats.com. Doing your homework is a necessary component of successful and profitable trading. Success rarely just happens. There’s typically a lot of hard work that goes into being successful and trading is no different. We keep ChartLists at StockCharts.com to organize all of our research. There is certain criteria to be met for any stock to be included on our various ChartLists. We have a number of ChartLists, but the following are three flagship ChartLists:
- Strong Earnings ChartList (SECL)
- Strong AD ChartList (SADCL)
- Raised Guidance ChartList (RGCL)
Let’s discuss each of these.
Strong Earnings ChartList (SECL)
I review thousands and thousands of earnings reports every quarter. I begin to narrow down this massive list of potential trading candidates by only including those companies that beat Wall Street consensus estimates as to both revenues and EPS. This is a significant fundamental piece of our research. To me, this is just common sense. Management teams that are executing their business plans and are able to beat expectations on both the top and bottom lines are management teams that I’m going to trust more when they provide future guidance. Doesn’t that just make sense? So I start with this. I then look at the chart of each company to make sure it’s liquid (ie, trading more than 200,000 shares daily). Then my final filter is relative strength. It’s extremely important to me that a company is either a leader in its industry OR at least that its industry group is strong. The first two criteria are very objective. This last one – providing a technical review – is definitely more subjective. This SECL typically is comprised of roughly 250-500 companies at any given point in time. A company that is added to the SECL will remain on this list until it approaches its next earnings date. It’ll then be removed. If it reports its next quarterly results and meets the three criteria again, it’ll be re-added. Our SECL is similar to a revolving door of great companies coming in and then departing a couple months later.
Here’s an example of a company that was recently added to this ChartList:
Phototronics, Inc. (PLAB):
- Revenues: $204.51 mil (actual) vs. $192.55 mil (estimate)
- EPS: $.49 (actual) vs. $.35 (estimate)
That’s an easy revenue and EPS beat in a very difficult market environment. The following PLAB chart shows both liquidity and relative strength:
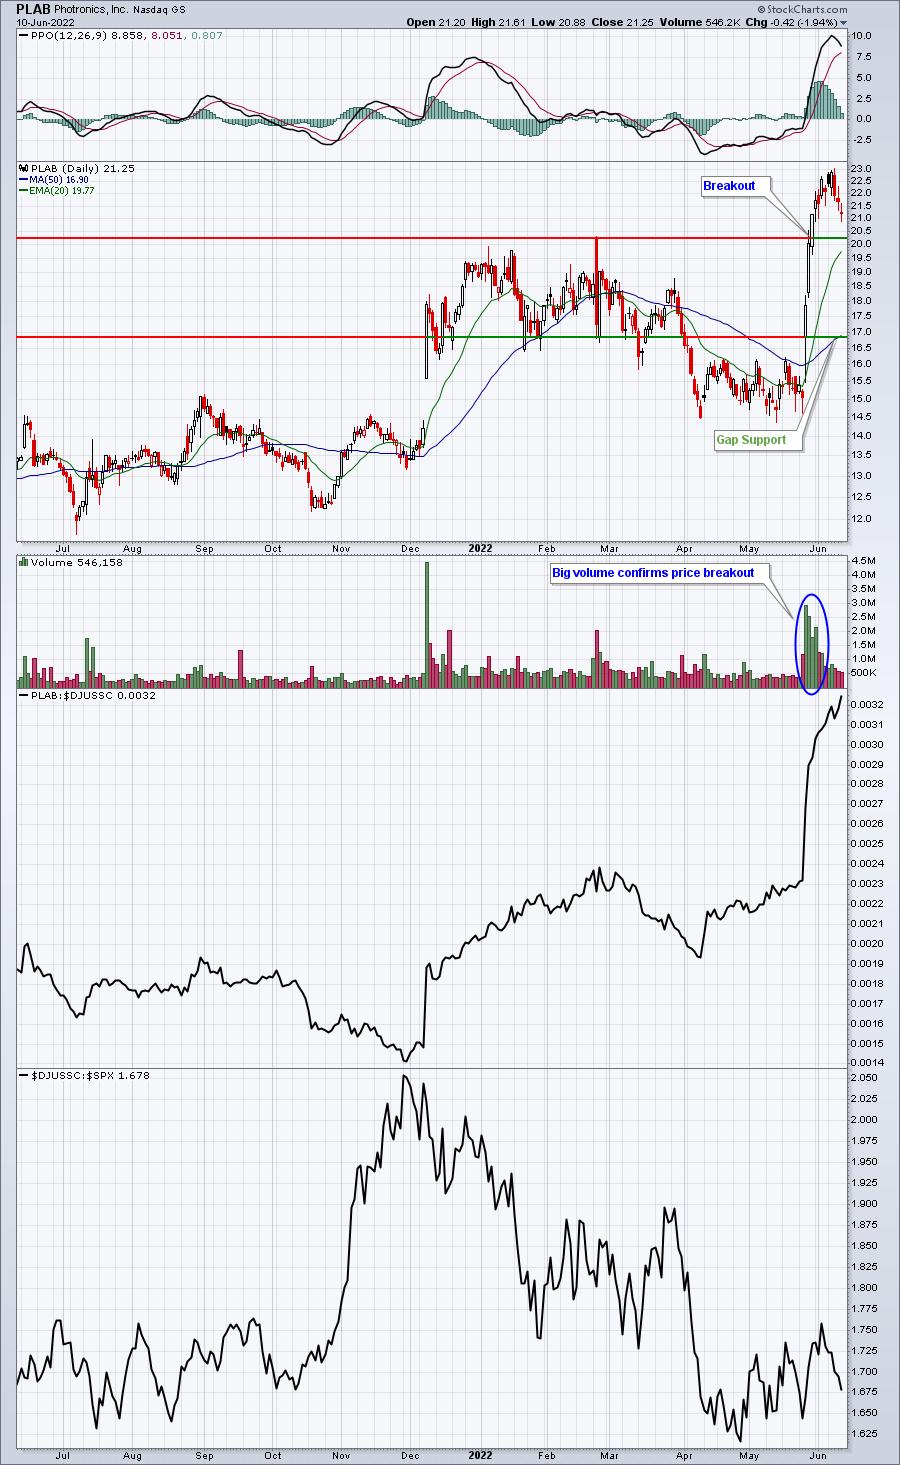
That middle panel shows PLAB vs. its semiconductor peers ($DJUSSC). I think it’s safe to say that PLAB is currently a leader in the DJUSSC. Right now, we have 270 charts on our SECL. That means there are 269 other charts like PLAB – all annotated with key price support levels – for our members to consider for possible trades. This is the homework we do.
Strong AD ChartList (SADCL)
This ChartList is put together strictly based on SCTR (StockCharts Technical Rank) scores above 70-75 in recent months PLUS a rising accumulation/distribution line (AD line). So in order to be included on this ChartList, a stock must show relative strength in the form of a SCTR score above 70 (objective criteria) and a strong or strengthening AD line (subjective criteria). To understand what these stocks are truly telling us, you must understand how AD lines are calculated. Rather than give you the formula, let me just say that the AD line is a cumulative reading that goes up and down based on volume AND where a stock closes relative to its intraday high and low. Stocks that finish above their trading range midpoint see rising values, while stocks that finish below their trading range midpoint see falling values. Stocks with strong AD lines tend to perform well off early intraday lows.
Here’s an example of what I look for:
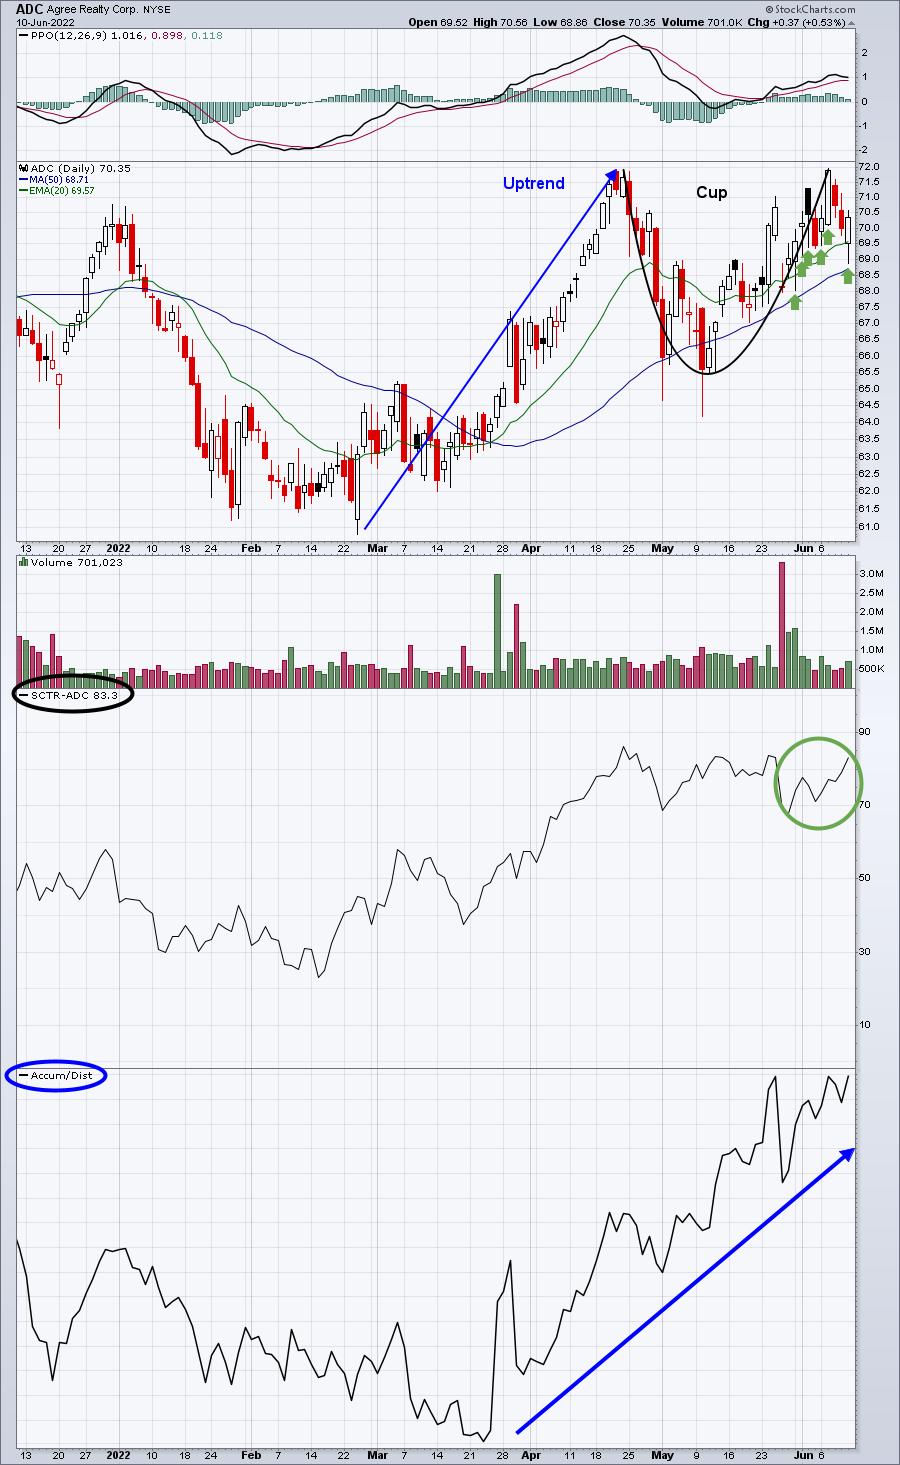
Agree Realty Corp (AGC) is an example of a stock with a steadily-rising AD line. It also just printed a handle on its 20-day EMA test to follow the cup that formed over the prior 6-7 weeks. But I want you to look at the rising AD line since late March. That’s certainly one sign of accumulation. Market makers have a duty to acquire shares for their institutional clients at the best price possible. Early morning selling can trigger many traders to sell prematurely. When institutions accumulate, it’ll typically result in prices rising throughout the day. Those green arrows highlight several days where AGC closes well above intraday lows. I like to use our Strong AD ChartList stocks as potential trading candidates in the morning – if they’re trading lower. It always helps to have other corroborating technical evidence like a cup with handle pattern or a 20-day EMA test to confirm a solid trading opportunity.
There are 348 charts on this ChartList currently.
Raised Guidance ChartList (RGCL)
This one is rather self-explanatory. If a company raises guidance – revenues and/or EPS – we add it to our RGCL unless volume is too thin – typically if the average is less than 200,000 shares a day. When Kimberly Clark Corp (KMB) reported better-than-expected revenues and EPS in April, they also raised guidance for the upcoming quarter. It’s taken six weeks, but KMB has potentially just printed a double bottom at key gap support:
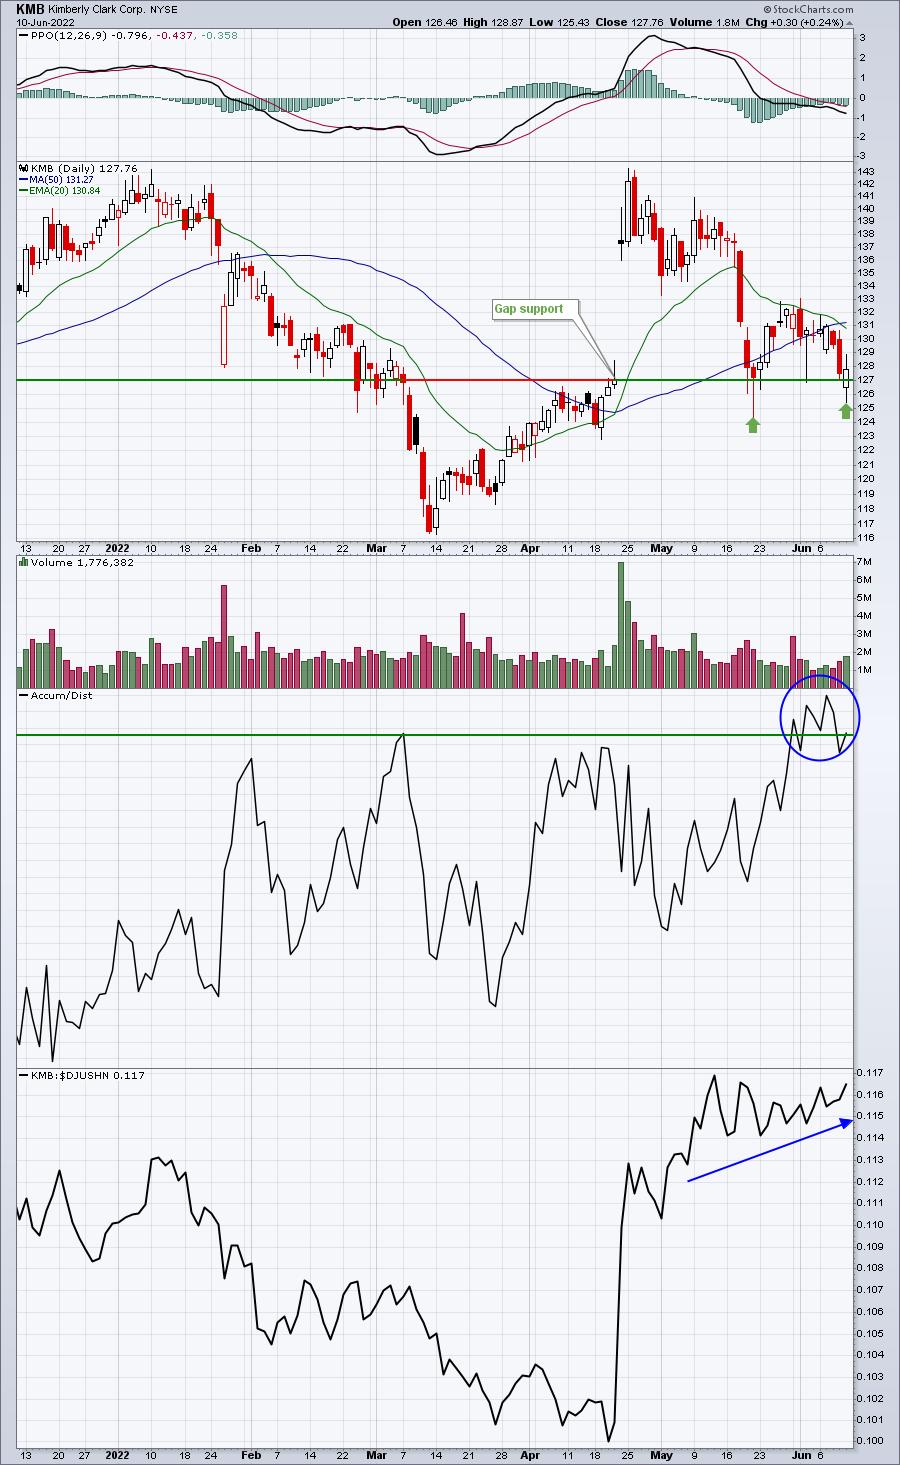
I don’t currently own KMB (or either of the two stocks previously discussed), but I do REALLY like this setup. First, KMB is a defensive stock, which will have a much better chance of appreciation if the market continues to fall, because money typically rotates from aggressive sectors to defensive sectors during selloffs. If it does continue moving lower, we’re near a critical gap support level, so a fairly tight stop can be placed to minimize any loss. Next, as KMB falls back near a 2-month low, its AD line is on the verge of breaking out, suggesting that morning weakness could present an excellent opportunity for an intraday reversal and profit. Finally, check out KMB’s relative strength vs. its industry peers – straight up.
KMB is 1 of 404 stocks currently on our RGCL.
Bullish Trifecta ChartList (BTCL)
The 3 ChartLists above are 3 different angles to take to identify potential trading candidates. They feature 1022 charts that meet our strict rules for inclusion in each specific ChartList. But what would happen if we combined ALL the filters of all 3 ChartLists? Well, we feature that ChartList too. It’s called our Bullish Trifecta ChartList (BTCL). There are 37 common companies on the 3 featured ChartLists above and they comprise our BTCL. These are what I’d consider the “best of the best”. The S&P 500 has fallen 2.50% over the past month, while the average GAIN among these 37 stocks is +0.16%. That means this widely-diversified group of 37 stocks has outperformed the S&P 500 by 2.66 percentage points in just the last 30 days. If you’re trying to outperform the benchmark, it sure seems like trading stocks off this list would increase your odds.
On Monday, June 13th, I’ll feature 1 of these 37 companies on our FREE EB Digest newsletter. I’ll also provide a link and password to the ENTIRE ChartList. If you’re a StockCharts.com Extra or Pro member, you’ll be able to download this ChartList directly into your account. If you’re a Basic member or a non-member at StockCharts.com, then you’ll be able to VIEW the charts, but you won’t be able to download them. Either way, you’ll see which stocks you should be watching in the days and weeks ahead – especially if we’re able to eventually print a capitulatory bottom. CLICK HERE to sign up for our EB Digest and to receive these 37 names!
Happy trading!
Tom