From time to time I present Long/Short or Pair trading ideas in my weekly Sector Spotlight show on Stockcharts TV. Since a few months I have started to track these ideas as a portfolio. This is by no means an advisory service or a model portfolio of any kind but more an example of the practical implementations of ideas generated from Relative Rotation Graphs. Especially because I sometimes do not spend enough attention to these positions and only look at them from time to time which causes me to be (too) late to exit positions that start to impact the portfolio negatively.
Having said that it, nevertheless, remains an interesting exercise to keep up with.
In last week’s Sector Spotlight I removed the short position in EWH (iShares MSCI Hong Kong) and replaced it with a new short position in DISH.
In this article I will go over and review all existing position in the basket.
The LONG Side
Currently the basket holds five LONG positions. These are shown in the RRG below.

This weekly RRG shows a five period tail which is the normal setting I use for most RRGs and has nothing to do with the holding period in the basket. As we can see all stocks except IVE are located at the right hand, positive, side of the graph. But these stocks also all show a decline in relative momentum over the last weeks. The good news is that that loss of relative momentum has not yet led to a significant loss in relative strength (moving lower on the JdK RS-Ratio scale).
Let’s have a look at the individual charts to make an assessment of each position.
SEE
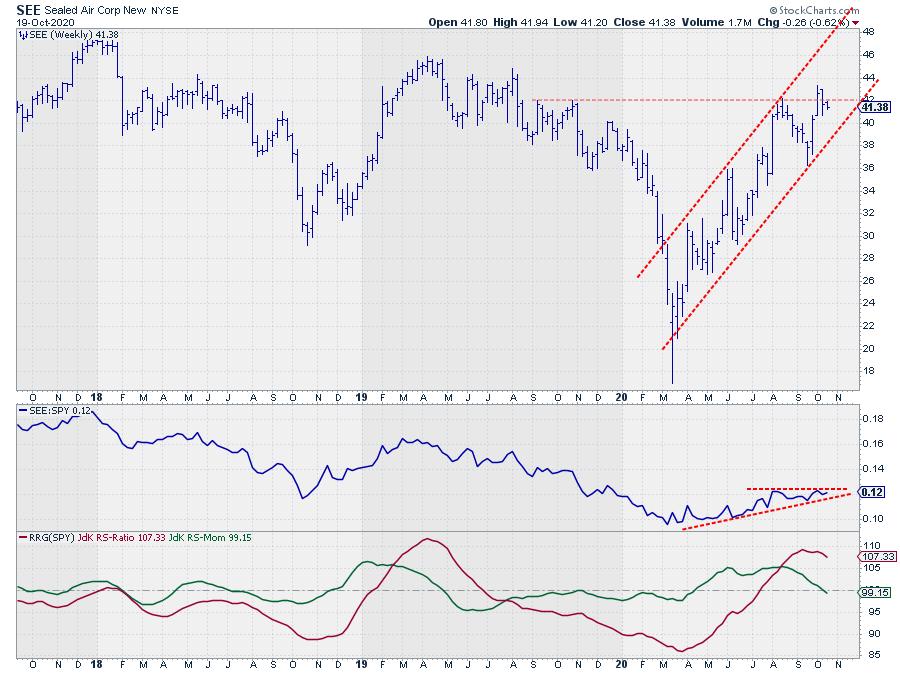
SEE is moving in a nice series of higher highs and higher lows, contained in a rising channel on the price chart. At the moment SEE is running into resistance around current levels (~$ 42).
Relative Strength is also running into a minor horizontal resistance level, causing the JdK RS-Momentum line to roll over and cross below 100 while JdK RS-Ratio remains comfortable above 100 signalling that the relative uptrend of SEE vs SPY is still intact.
CTSH
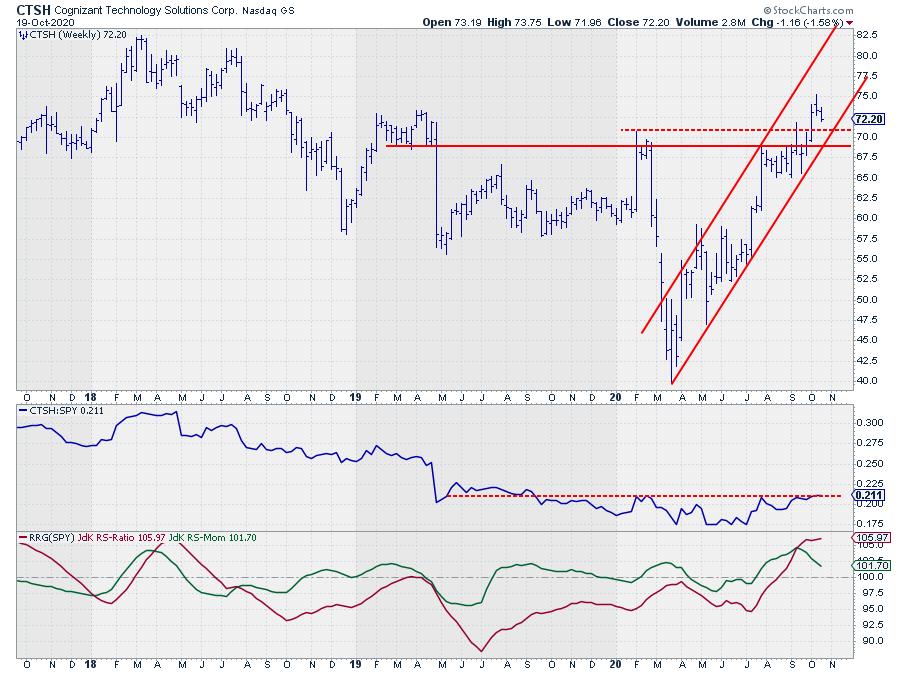
The uptrend in price is certainly there and just broke above a horizontal resistance level around $ 70. Such a break did not happen yet in relative strength which is pushing against a horizontal boundary.
The initial improvement in relative strength which translated into a rotation from lagging, through improving into leading. The flat move in the RS-line which started when it hit overhead resistance is now causing the tail to roll over while inside leading.
With the price trend fully intact and above support and a relative line close to potentially breaking higher are reasons to stay with this position.
IVE
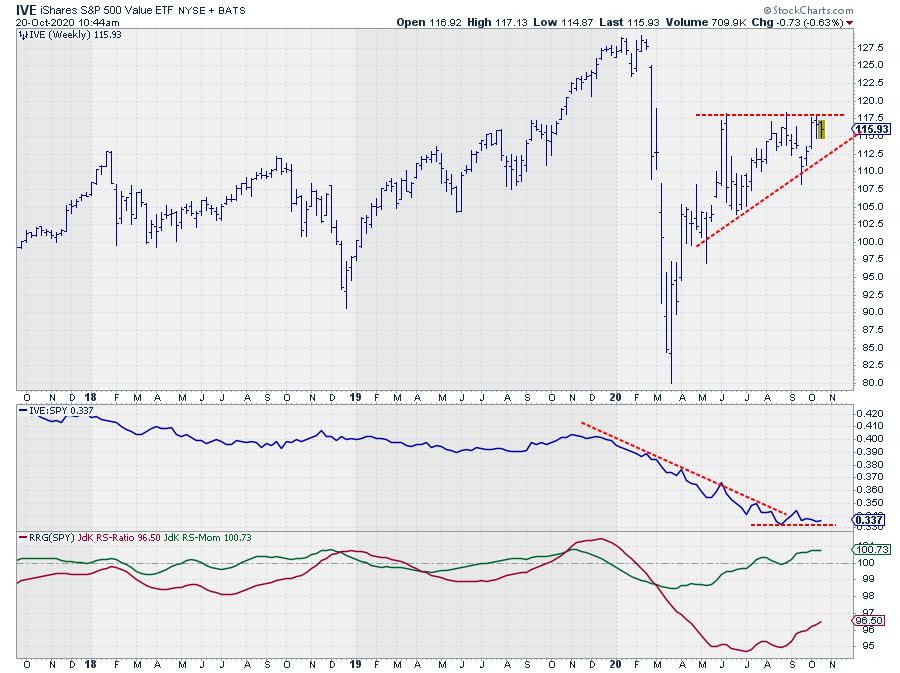
IVE, value, is the opposite of IVW, growth, which is in the short basket. This combination was added to the basket when relative strength for Growth started to wane and Value started to pick up.
This process can be seen on the chart above where the RRG-Lines gradually started to pick up steam over the summer when raw relative strength started to loose downward momentum.
The, expected, move did not yet materialize significantly but the improvement in relative strength for IVE (above) vs the deterioration for IVW remains visible.
Watch this chart for a break above the horizontal resistance of that ascending triangle, in combination with a turn around in relative strength, for an acceleration upward.
FCX

FCX is the strongest contributor to the return of the basket and is still going strong as the stock is pushing to a new high while I am writing this article.
Recently there has been a little loss of relative momentum which has caused the tail on FCX to roll over and head towards the weakening quadrant but RS-Ratio levels are so strong that the odds are in favor of a leading-weakening-leading rotation on the RRG which is one of the characteristics of a strong relative trend.
XLB

XLB is closest to the 100-level on the JdK RS-Ratio scale of all stocks in the LONG basket that are at the right side of the graph. But it also has a very short tail. This implies that XLB is in a stable relative uptrend vs SPY. And this can be seen on the RS-Line where we find a regular rhythm of higher highs and higher lows in relative strength.
Recently RS broke above a horizontal level that had been respected both as resistance and support in the past and is currently doing so again, this time as support.
On the price chart, XLB is pushing against resistance form its previous high near $ 67. Once that can be taken out, expect an acceleration in price, followed by a renewed improvement in relative strength.
The SHORT Side
The RRG below shows the rotation for the five short positions that are currently present in the basket.
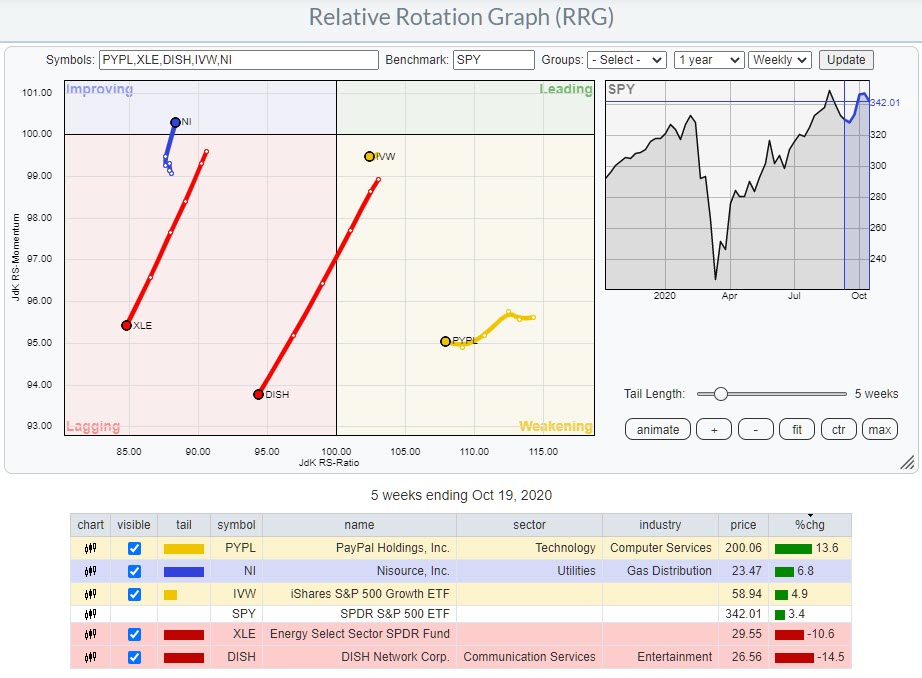
The tails for XLE and DISH are exactly what you want to see for short positions. the other need a bit more inspection and analysis.
PYPL

PayPal was added as a short in the second half of July when the tail started to roll over inside the leading quadrant expecting a deterioration of relative strength and a subsequent downward break of a very steep rising trendline. Both of the expectations materialized but PYPL rapidly bounced together with the general strength of the Technology sector.
This causes PYPL to be a negative contributor at the moment but I prefer to keep it as a short as the rationale for adding the stock is still there. Weak(ening) relative strength and price struggling near resistance after breaking a steep trend.
At least some sort of setback, even if only temporary, would fit this scenario.
NI
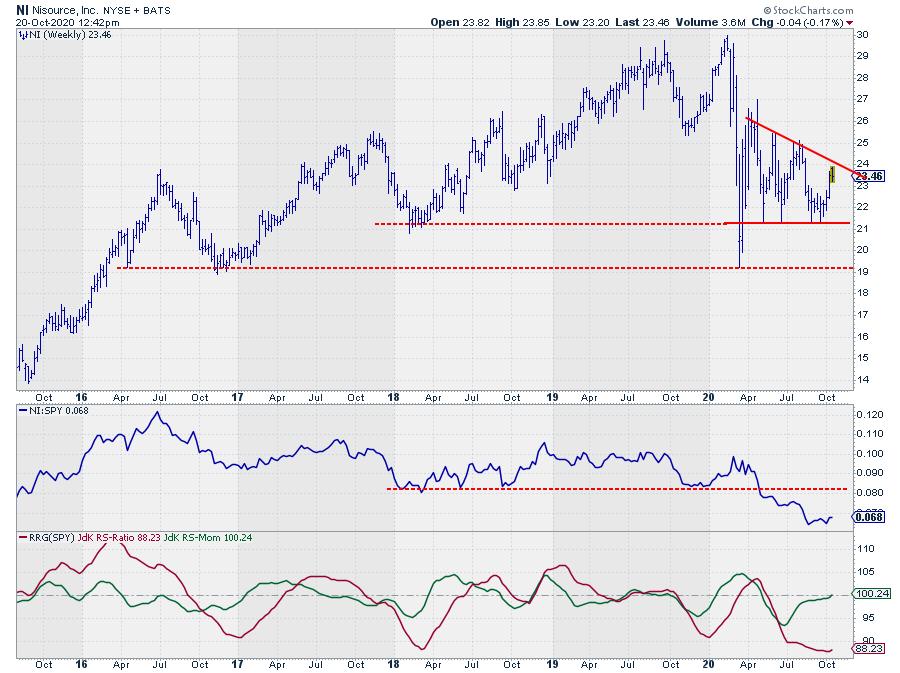
Initially Nisource deteriorated in relative terms as expected but because of the general strength of the market price did not, really, follow yet. And in a long/short portfolio that is fine. As a matter of fact that is exactly what you want or expect. When the market goes up the biggest contributions will come from the long positions and when the market goes down the shorts should start to work in our favor.
The challenge is to manage the positions in such a way that they will not kill you. I.e. a short that blows through the roof or a long that sinks like a stone.
Given the position of the tail and its, short, length on the RRG, NI remains a short candidate. Price seems captured inside a descending triangle which will execute on a break below, say, $ 21.75. The first support level after such a break will be near $ 19 and much more room for downside is available after that.
The relative strength line broke an important horizontal support level back in May causing the tail to rapidly rotate into the lagging quadrant.
Given the low value of the RS-Ratio, the lack of relative momentum and the short tail on the RRG, in combination with a descending triangle on the price chart this remains a good short candidate.
IVW
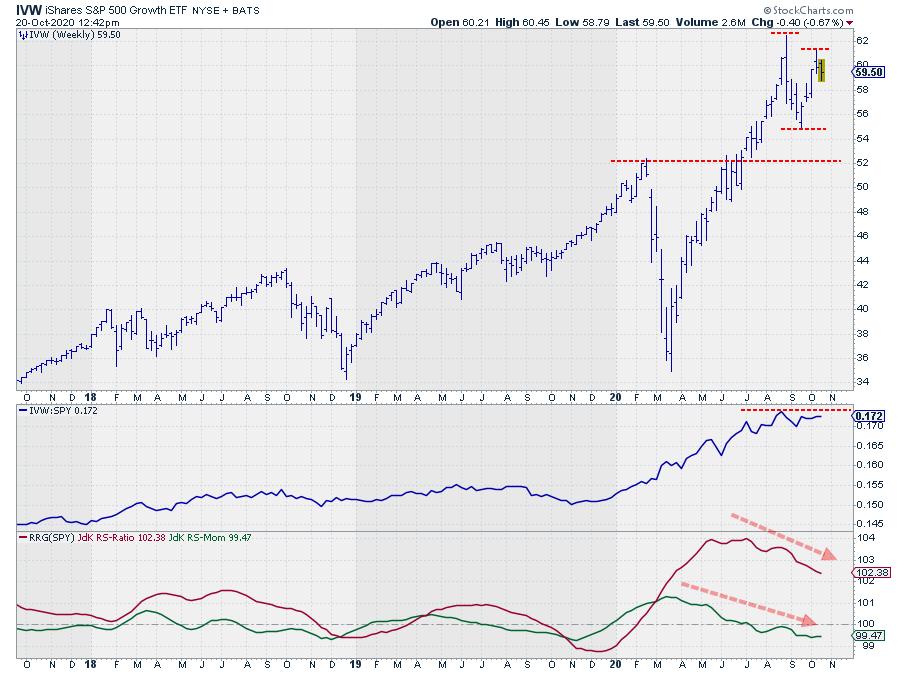
IVW is the counterpart of the IVE-IVW (pair-) trade as described in the lon section. Here the rolling over of relative strength is becoming more and more visible.
Price has not followed yet but when it does. For IVW for instance a break below the recent low near $ 54.50 things could accelerate fast.
XLE

I am tempted to call XLE the mother of all shorts. This sector has been rotating at the left side of the RRG since mid-2018 and the end is not in sight. As a matter of fact the recent break of relative strength below its previous low, once again … only confirms this major relative downtrend that is in play for energy.
From a price perspective, things do not look much better. The break to a ten-year low in March was the trigger for much more downside price movement. The rally from the late-March low back to the breakout level was impressive, close to a 100-% gain, but from a technical point of view it was nothing more than a pull-back and recent price action is proving that with the series of lower highs and lower lows re-ignited!
DISH
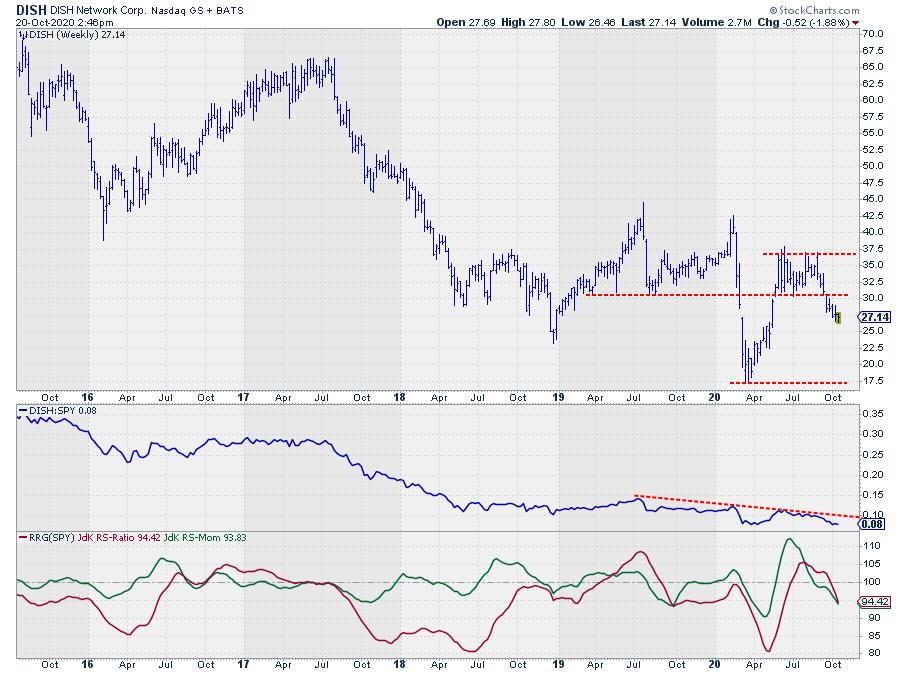
DISH is the latest addition to the short basket, replacing EWH as I discussed last week in Sector Spotlight.
DISH is in the Communication Services sector which is rotating inside the weakening quadrant and towards lagging. As the price chart for XLC was still holding up well, at least a week ago, I started looking for single stocks inside XLC that might offer downside potential and I ended up with DISH.
The weakness in relative strength is obvious, well inside the lagging quadrant and the RS-line about to break to new lows while both RRG-Lines are rapidly declining.
On the price chart a double top was completed a few weeks ago which give the stock downward potential towards support near $ 17.50 and upside “risk” only to ~$ 30.
Reason enough to add it as a new short to the basket.
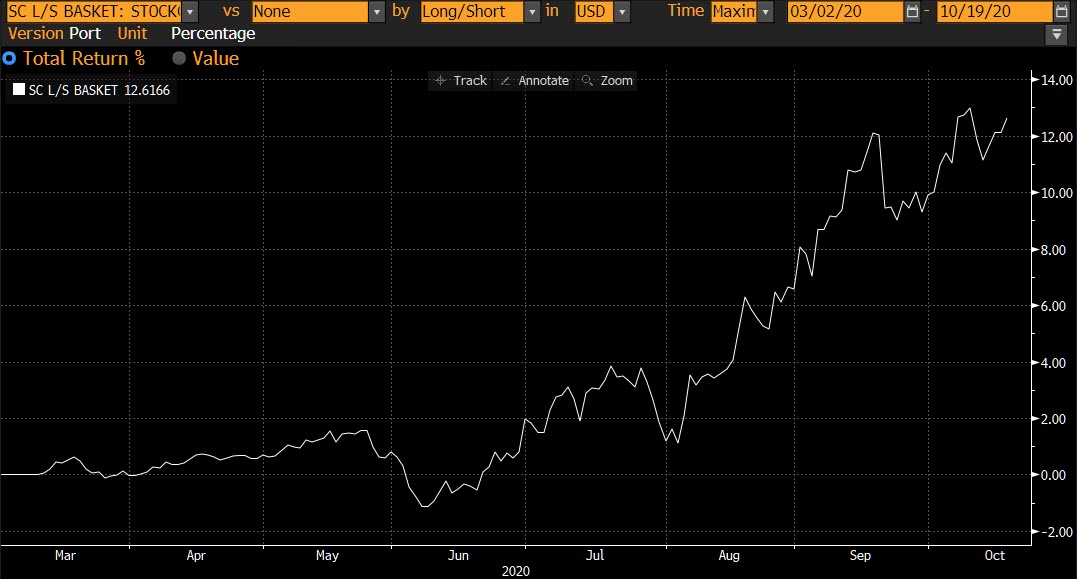
So far so good
Here’s the P/L line for the baskets since I started tracking them. So far each side had a maximum of five positions at $ 10.000 each, long or short. No accounting is done for lending or margin requirements.
#StaySafe, –Julius