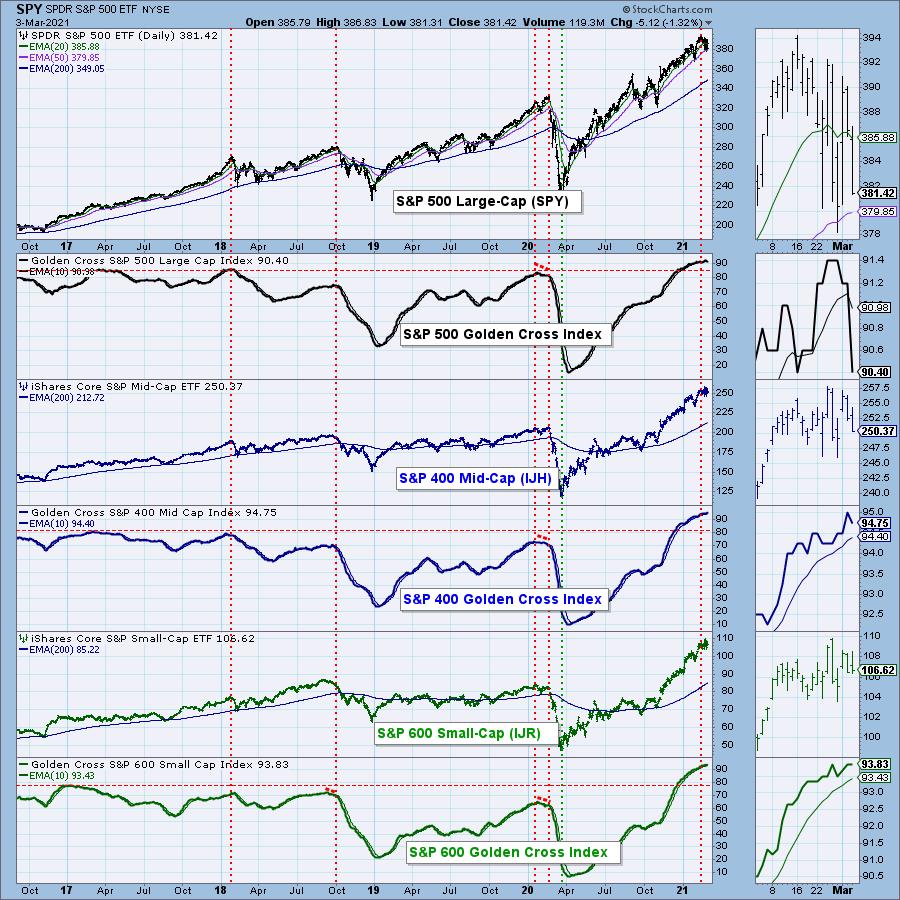
We have seen the Golden Cross Index (GCI) sitting at its “all-time high” (data since 2017) for some time. Today, it dropped a full percentage point. It moves fairly slowly, so this decline was significant in my estimation. Below, I have the Golden Cross Index chart for the major indexes. Notice all of them are extremely overbought. The S&P 600 has the healthiest as it only moving sideways. This isn’t surprising as small-caps have been outperforming the large-caps. It appears the longer-term foundation of the SPX is beginning to show small cracks. Note that cardinal tops (marked with the red vertical line) typically arrive when the GCI tops. I don’t think this is over just yet.
IN JUST 10 MINUTES, EVERYTHING YOU NEED TO KNOW!
The DP Alert is the perfect primer to end every market day. In 10 minutes or less, you can read the daily DP Alert and know where the market is headed in the short- and intermediate-terms. You also get a review of Dollar, Gold, Gold Miners, Crude Oil and Bonds DAILY! We review the same charts to give you context and continuity, with interesting additions to complement the analysis for the day. Each report is easy to read and understand regardless of your level of experience.
SUBSCRIBE TO OUR BUNDLE TODAY and get one free week using this coupon code: DPTRIALCW. That is a $20 value for free!

Free DecisionPoint Trading Room on Mondays, Noon ET
Recordings Sent to All Registrants!

*Click here to register for this recurring free DecisionPoint Trading Room on Mondays at Noon ET!*
ALL REGISTRANTS RECEIVE A COPY OF THE RECORDING AT THE END OF THE DAY
Conclusion: Relative performance can help you select the strongest performers within a strong (or weak) industry group. Just remember, if the industry group as a whole is not outperforming, your confidence level should be lower even if your stock is outperforming within the industry group. Think of it this way – a stock could be in decline and still show strong relative performance to its brethren, simply because it is falling at a slower rate.
Happy Charting!
– Erin
Technical Analysis is a windsock, not a crystal ball.
Helpful DecisionPoint Links:
DecisionPoint Alert Chart List
DecisionPoint Golden Cross/Silver Cross Index Chart List
DecisionPoint Sector Chart List
Price Momentum Oscillator (PMO)
Swenlin Trading Oscillators (STO-B and STO-V)
DecisionPoint is not a registered investment advisor. Investment and trading decisions are solely your responsibility. DecisionPoint newsletters, blogs or website materials should NOT be interpreted as a recommendation or solicitation to buy or sell any security or to take any specific action.