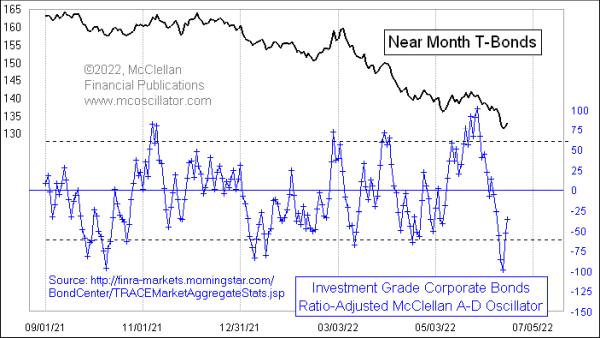
Last week, I wrote about some of the corporate bond Advance-Decline (A-D) data published by FINRA. The high yield bonds behave more like the stock market than like T-Bonds, so their behavior can be an indication about liquidity that will come around and affect the stock market. The investment-grade bonds are a different story, as they behave more like T-Bonds. Their A-D data is still valuable, if interpreted in the right way.
This week’s chart looks at a Ratio-Adjusted McClellan Oscillator for the investment-grade bond A-D data. On June 14, 2022, it reached its lowest reading since the COVID Crash in March 2020 (not shown). Extreme readings like this are pretty uniformly exhaustive in their nature, helping to signal washout selloffs in T-Bond prices.
Bond traders have understandably gotten worried about inflation recently. If the value of the dollar is falling by 8+% per year, then the real future value of all your coupon payments on a bond investment will naturally go down. When those worries reach a climax, it shows up as investors collectively abandoning their supposedly high-grade corporate bonds. And that gets reflected in a big oversold reading for this McClellan Oscillator.
During this price downtrend, we have also seen some overbought readings that did a good job of marking price tops. For this particular version of the McClellan A-D Oscillator, overbought readings more uniformly mark short term tops, as opposed to signaling initiation of a strong uptrend as we often see in the stock market.
In a concerted downtrend, it is possible for the bond market (or stocks, or anything) to ignore an oversold condition. But when we see the biggest oversold condition in a couple of years, it tends to draw our attention and tell us that something special is happening.