Farmers in the U.S. were excited this week about the news of China agreeing to buy 1.9 million tons of corn. That news has not yet given a lift to corn futures prices, but this week’s chart says that a major multi-month uptrend is coming.
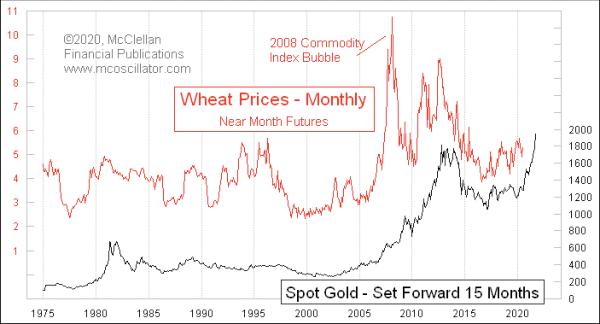
The movements of gold prices tend to show up again about 15 months later in grain prices. And it works not just for corn, but also for wheat prices:

The wise reader may wonder why this phenomenon works so well, but wondering about that can get in the way of seeing it and accepting it. Gold has been freely traded in the U.S. only since 1975 (before 1971, prices were fixed), and this phenomenon has been working, for the most part, for all 45 years of that history. At some point, the evidence becomes sufficient to accept a phenomenon as real, even if we cannot explain why it should work.
Gold prices have been on a tear since 2018, especially in 2020. That should mean a big upward move 15 months later as grain prices echo gold’s move. We are right at that inflection point right now.
Wheat and corn are big inputs into other food costs, serving as both raw materials for processed food items and as feed for cattle and pigs. So it is natural to observe that overall food costs will fluctuate in sympathy with those grain prices.
The curious point, however, is that overall food prices seem to move first. Here is a comparison of gold’s price movements to a 12-month rate of change (ROC) for the CPI Food and Beverage series:

To fit the patterns in this chart, I have to shorten the forward offset of gold prices from 15 months down to 12 months. We are already seeing the food price increase that gold is calling for show up here, even though it has not yet shown up in wheat and corn prices. The COVID disruption to supply chains is likely getting the credit for this in the minds of most economists and analysts. Yet gold somehow knew in advance that it was coming. And gold’s message says that overall food prices should continue to rise for at least the next 12 months.