CoreLogic® … today released the Homeowner Equity Report (HER) for the first quarter of 2022. The report shows U.S. homeowners with mortgages (which account for roughly 62% of all properties) have seen their equity increase by 32.2% year over year, representing a collective equity gain of $3.8 trillion, and an average gain of $63,600 per borrower, since the first quarter of 2021.
…
“Price growth is the key ingredient for the creation of home equity wealth,” said Patrick Dodd, president and CEO at CoreLogic. “Home prices were up by 20% in March compared to one year earlier in CoreLogic’s national Home Price Index. This has led to the largest one-year gain in average home equity wealth for owners and is expected to spur a record amount of home-improvement spending this year.”Negative equity, also referred to as underwater or upside-down mortgages, applies to borrowers who owe more on their mortgages than their homes are currently worth. As of the first quarter of 2022, the quarterly and annual changes in negative equity were:
• Quarterly change: From the fourth quarter of 2021 to the first quarter of 2022, the total number of mortgaged homes in negative equity decreased by 5.3% to 1.1 million homes, or 2% of all mortgaged properties.
• Annual change: In the first quarter of 2021, 1.4 million homes, or 2.6% of all mortgaged properties, were in negative equity. This number decreased by 23%, or approximately 300,000 properties, in the first quarter of 2022.
Because home equity is affected by home price changes, borrowers with equity positions near (+/- 5%) the negative equity cutoff are most likely to move out of or into negative equity as prices change, respectively. Looking at the first quarter of 2022 book of mortgages, if home prices increase by 5%, 130,000 homes would regain equity; if home prices decline by 5%, 167,000 properties would fall underwater.
emphasis added
 Click on graph for larger image.
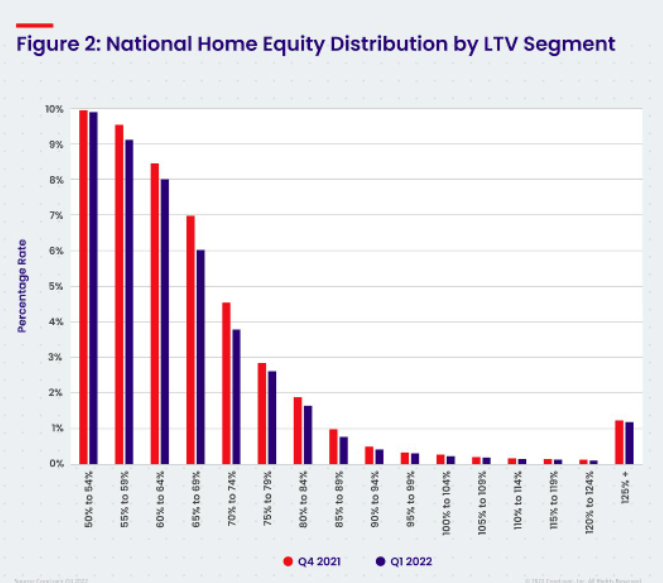
This graph from CoreLogic compares Q1 2022 to Q4 2021 equity distribution by LTV. There are still a few properties with LTV over 125%. But most homeowners have a significant amount of equity. This is a very different picture than at the start of the housing bust when many homeowners had little equity.
On a year-over-year basis, the number of homeowners with negative equity has declined from 1.4 million to 1.1 million.