Construction spending during July 2021 was estimated at a seasonally adjusted annual rate of $1,568.8 billion, 0.3 percent above the revised June estimate of $1,563.4 billion. The July figure is 9.0 percent above the July 2020 estimate of $1,439.6 billion.
emphasis added
Private and public spending increased:
Spending on private construction was at a seasonally adjusted annual rate of $1,231.0 billion, 0.3 percent above the revised June estimate of $1,227.8 billion. …
In July, the estimated seasonally adjusted annual rate of public construction spending was $337.8 billion, 0.7 percent above the revised June estimate of $335.6 billion.
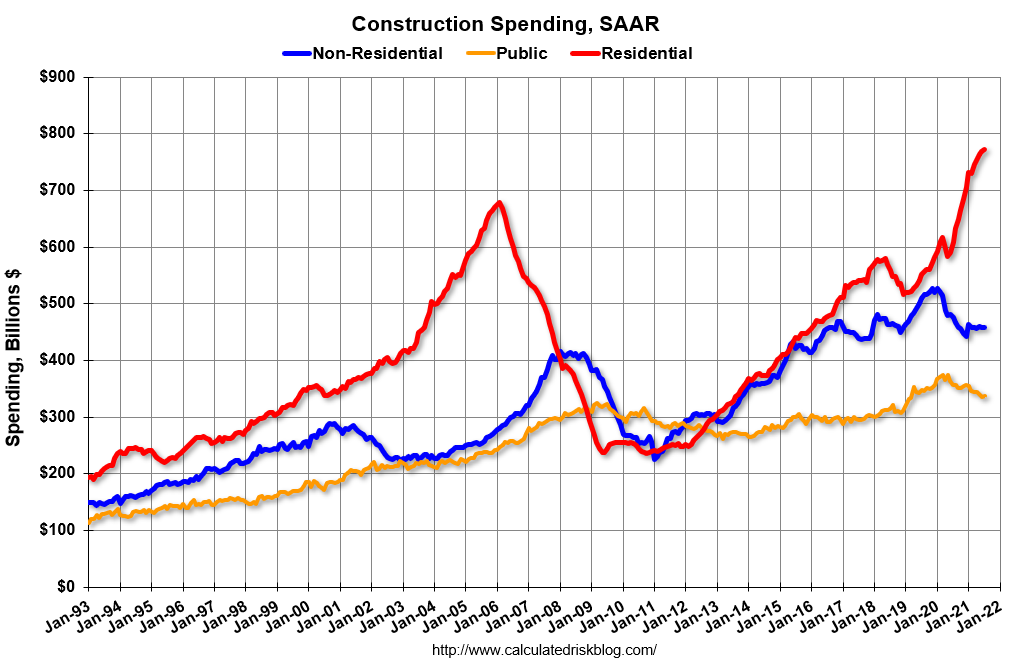 Click on graph for larger image.
This graph shows private residential and nonresidential construction spending, and public spending, since 1993. Note: nominal dollars, not inflation adjusted.
Residential spending is 14% above the bubble peak (in nominal terms – not adjusted for inflation).
Non-residential spending is 10% above the bubble era peak in January 2008 (nominal dollars), but has been weak recently.
Public construction spending is 4% above the peak in March 2009, and 29% above the austerity low in February 2014, but weak recently.
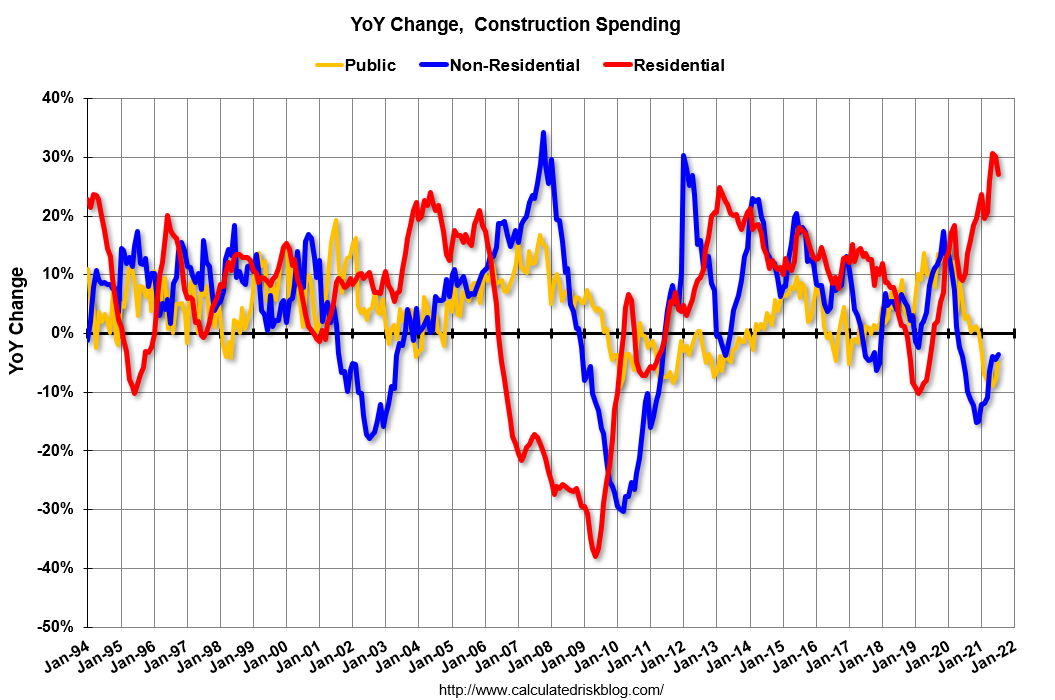 The second graph shows the year-over-year change in construction spending.
On a year-over-year basis, private residential construction spending is up 27.0%. Non-residential spending is down 3.6% year-over-year. Public spending is down 5.1% year-over-year.
Construction was considered an essential service in most areas and did not decline sharply like many other sectors, but some sectors of non-residential have been under pressure. For example, lodging is down 29.8% YoY, multi-retail down 3.4% YoY, and office down 6.1% YoY.