A few key points:
1) This was the highest sales rate for November since 2005. Some of the increase over the last several months was probably related to pent up demand from the shutdowns in March and April. Other reasons include record low mortgage rates, a move away from multi-family rentals, strong second home buying (to escape the high-density cities) and favorable demographics.
 Click on graph for larger image.
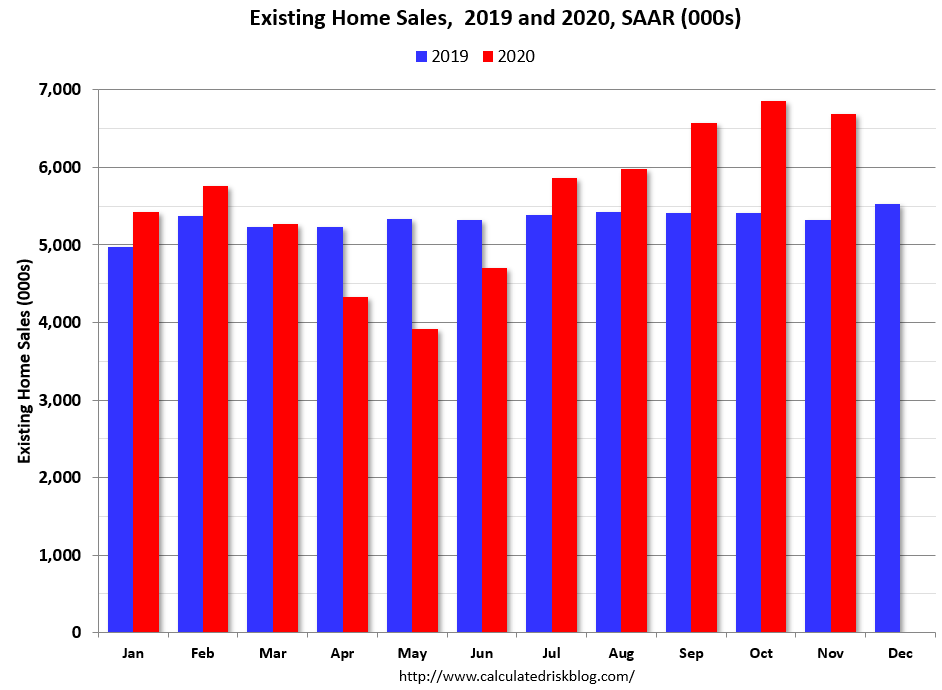
This graph shows existing home sales by month for 2019 and 2020.
Note that existing home sales picked up somewhat in the second half of 2019 as interest rates declined.
Even with weak sales in April, May, and June, sales to date are up about 4% compared to the same period in 2019.
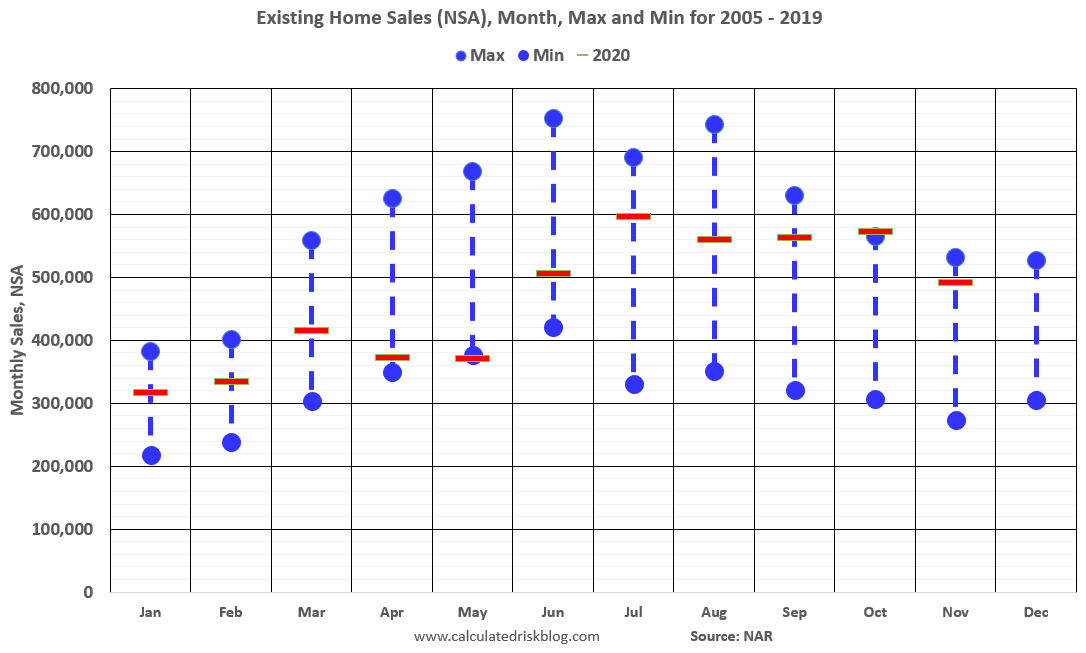 The second graph shows existing home sales Not Seasonally Adjusted (NSA) by month (Red dashes are 2020), and the minimum and maximum for 2005 through 2019.
Sales NSA in November (492,000) were 22% above sales last year in November (404,000). This was the highest sales for November (NSA) since 2005.