Earlier: Housing Starts increased to 1.496 Million Annual Rate in July
Total housing starts in July were above expectations, and revisions to prior months were positive.
Low mortgage rates and limited existing home inventory is giving a boost to housing starts.
The housing starts report showed starts were up 22.6% in July compared to June, and starts were up 23.4% year-over-year compared to July 2019 (easy comparison).
Single family starts were up 7.4% year-over-year.
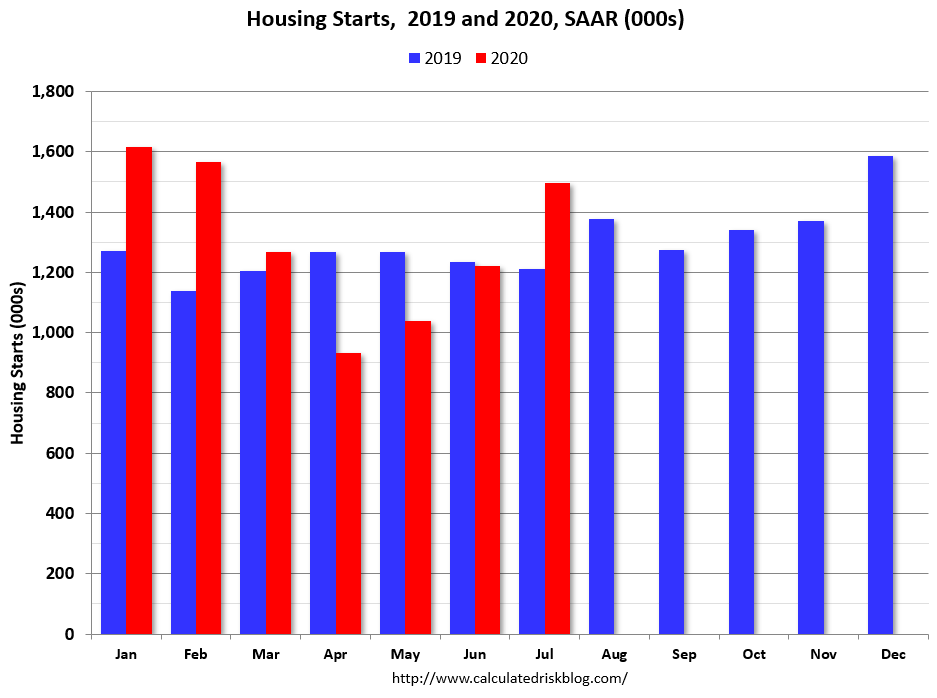
This first graph shows the month to month comparison for total starts between 2019 (blue) and 2020 (red).
 Click on graph for larger image.
Starts were up 22.6% in July compared to July 2019.
Last year, in 2019, starts picked up towards the end of the year, so the comparisons were easy in the first seven months of the year..
Starts, year-to-date, are up 4.7% compared to the same period in 2019. This is below my forecast for 2020, but I didn’t expect a pandemic!
I expect a further increase in starts in August, but the growth rate will slow.
Below is an update to the graph comparing multi-family starts and completions. Since it usually takes over a year on average to complete a multi-family project, there is a lag between multi-family starts and completions. Completions are important because that is new supply added to the market, and starts are important because that is future new supply (units under construction is also important for employment).
These graphs use a 12 month rolling total for NSA starts and completions.
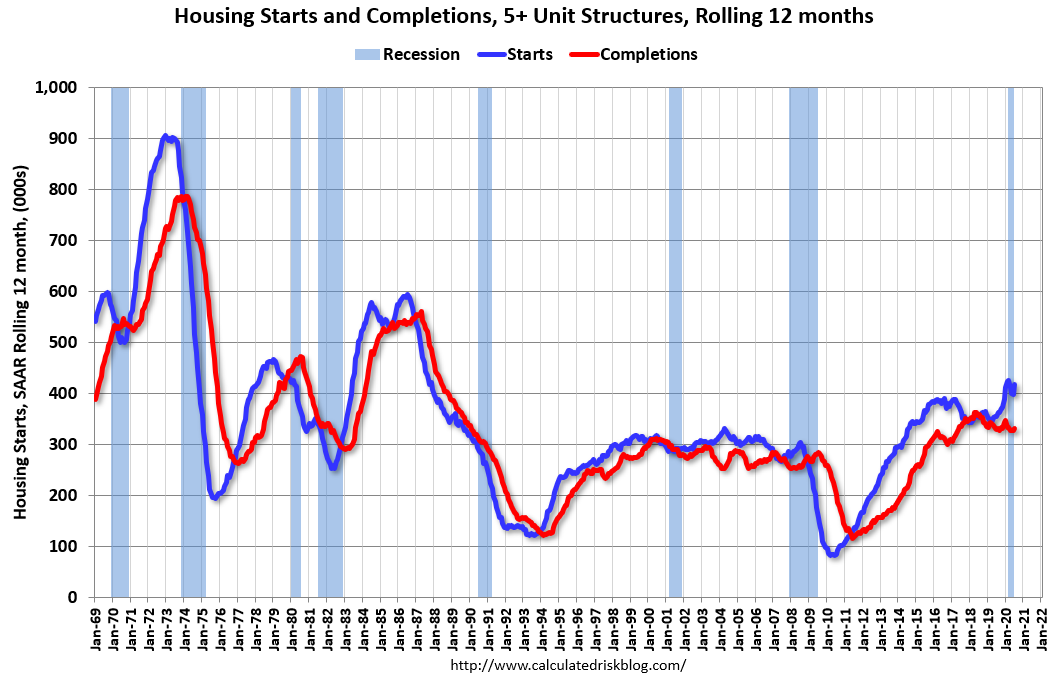 The blue line is for multifamily starts and the red line is for multifamily completions.
The rolling 12 month total for starts (blue line) increased steadily for several years following the great recession – then mostly moved sideways. Completions (red line) had lagged behind – then completions caught up with starts- although starts picked up a little again lately.
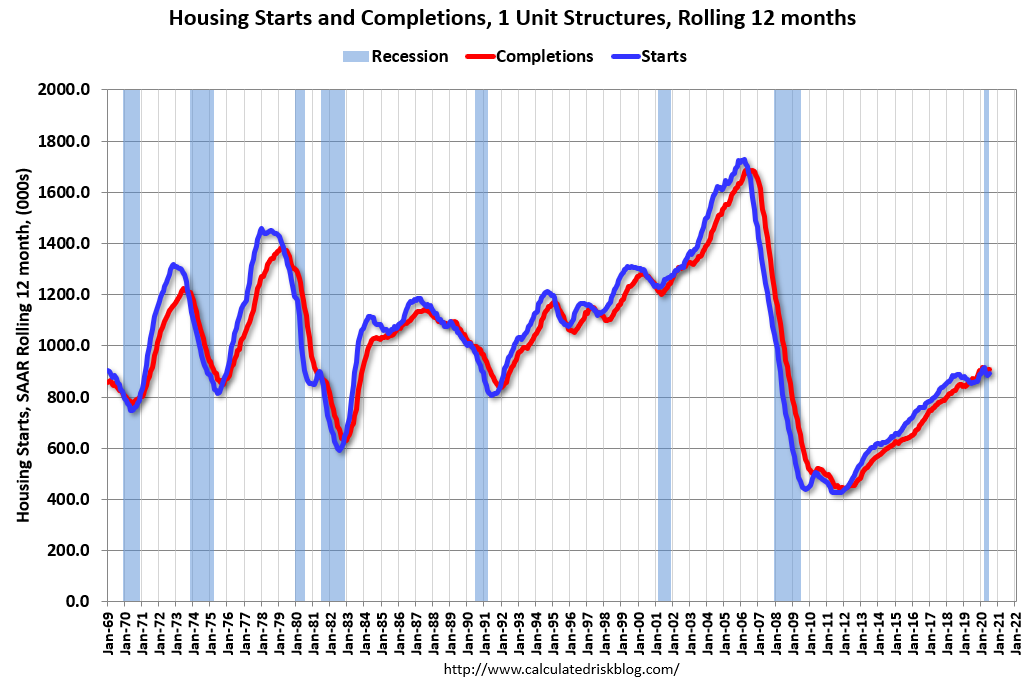 The second graph shows single family starts and completions. It usually only takes about 6 months between starting a single family home and completion – so the lines are much closer. The blue line is for single family starts and the red line is for single family completions.
Note the relatively low level of single family starts and completions. The “wide bottom” was what I was forecasting following the recession, and now I expect some further increases in single family starts and completions once the crisis abates.