A few key points:
1) Existing home sales are counted at the close of escrow, so this report is mostly for contracts signed in February and March. Some analysts think the April report will be the bottom for existing home sales – since purchase applications have increased recently – but my guess is that few contracts were signed in April, so reported sales in May (and maybe even June) will probably be lower.
2) Inventory is very low, and was down 19.7% year-over-year (YoY) in April. Inventory will probably stay fairly low as people wait to list their homes – and do not want strangers in their house. This is the lowest level of inventory for April since at least the early 1990s.
 Click on graph for larger image.
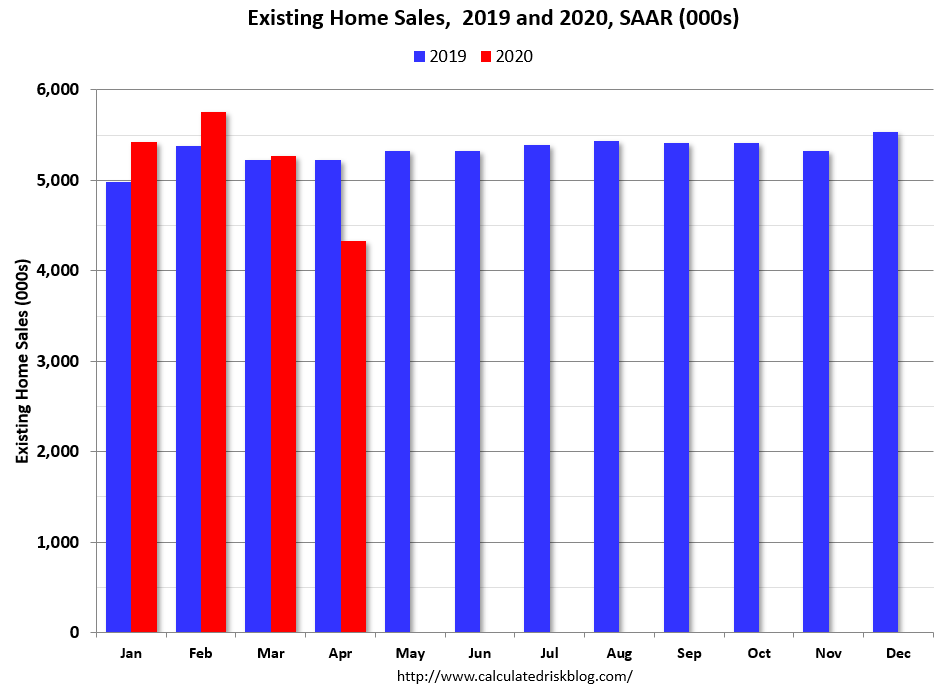
This graph shows existing home sales by month for 2019 and 2020.
Note that existing home sales picked up somewhat in the second half of 2019 as interest rates declined.
Even with weak sales in April, sales to date are only down about 0.8% compared to the same period in 2019.
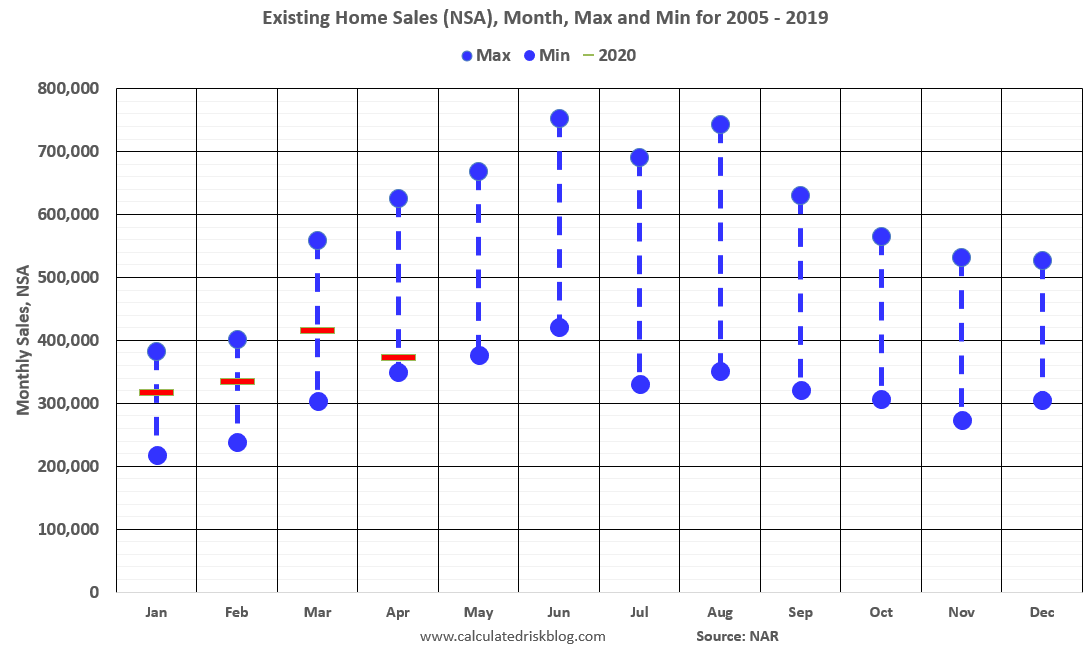 The second graph shows existing home sales Not Seasonally Adjusted (NSA) by month (Red dashes are 2020), and the minimum and maximum for 2005 through 2019.
Sales NSA in April (373,000) were well below sales last year in April (456,000).
Sales NSA were just above the minimum for April in 2009 (349,000).
It seems likely reported sales in May will be below the post bubble low of 376,000 in May 2009.