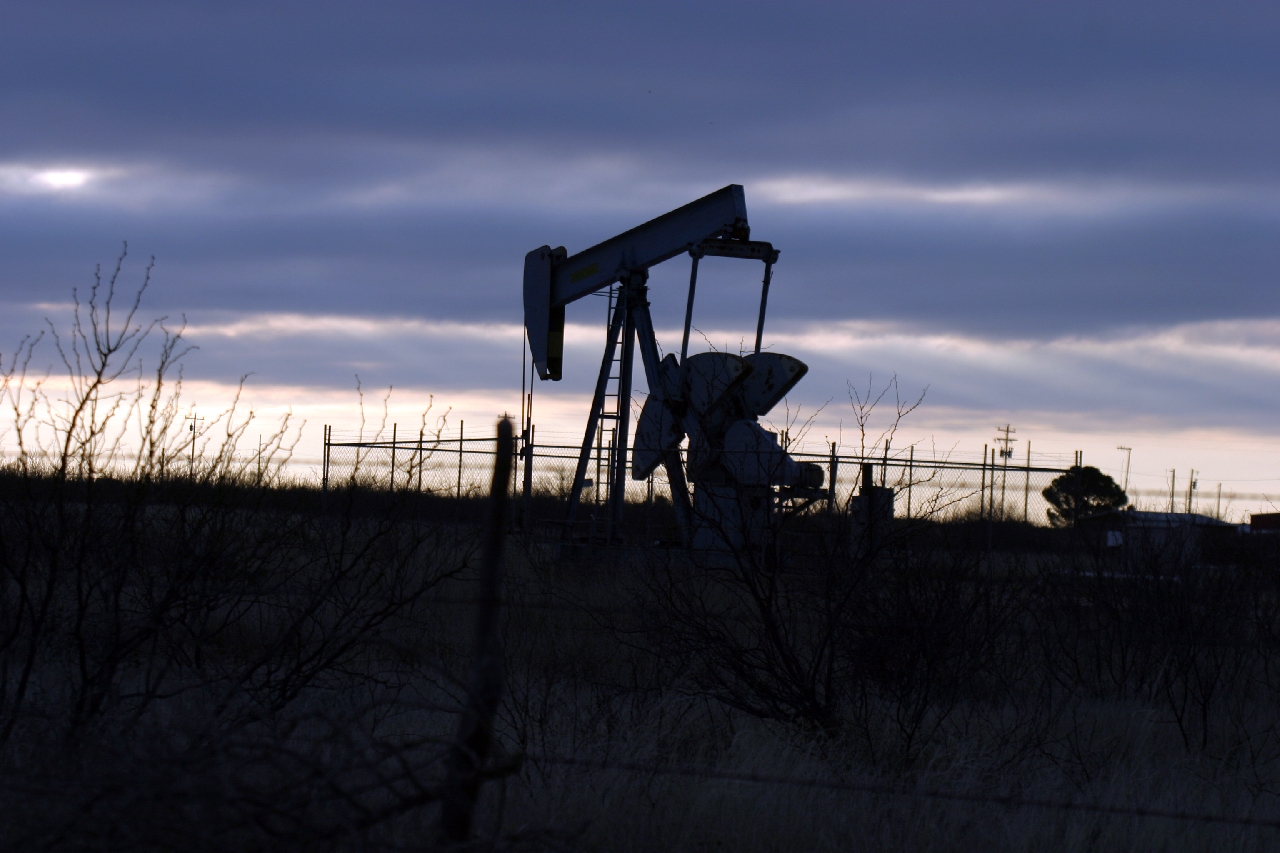
Watchers of my show Sector Spotlight will know that I have been watching the development of commodities as an asset class that’s going through a long turnaround. Recent developments continue to reinforce that view.
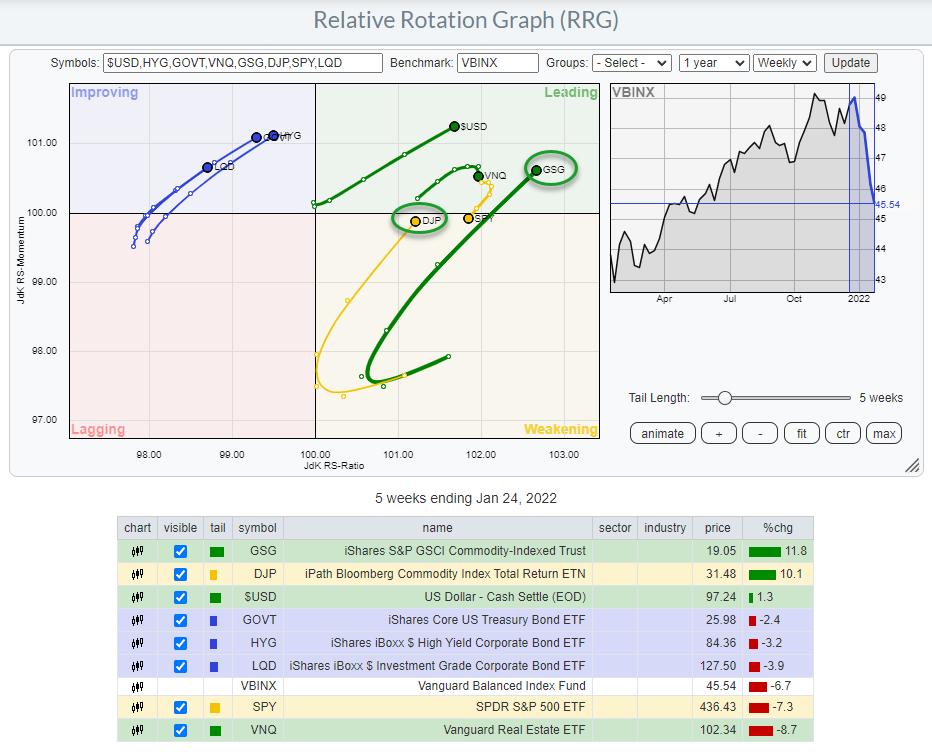
The Relative Rotation Graph shows the rotation for a universe of asset class ETFs vs. VBINX, the Vanguard Balanced Index Fund. The longest tails are for GSG and DJP, the two commodity ETFs that I track on this RRG/Universe. These tails entered the leading quadrant in September/October 2020 after coming from a long rotation through improving, after a multi-year period of underperformance.
Almost immediately after entering the leading quadrant, these tails started to roll over downward and lose relative momentum. That recovery from the depths of relative strength was taking its toll and needed time to refuel. In December ’20/January ’21, the tails curled back up and entered the leading quadrant at a strong RRG-Heading, setting off a new leg higher in the just-established relative uptrend. That process repeated again from April to October, when both tails once again rotated back into the leading quadrant from weakening, again at a strong RRG-Heading, and then again from November until now.
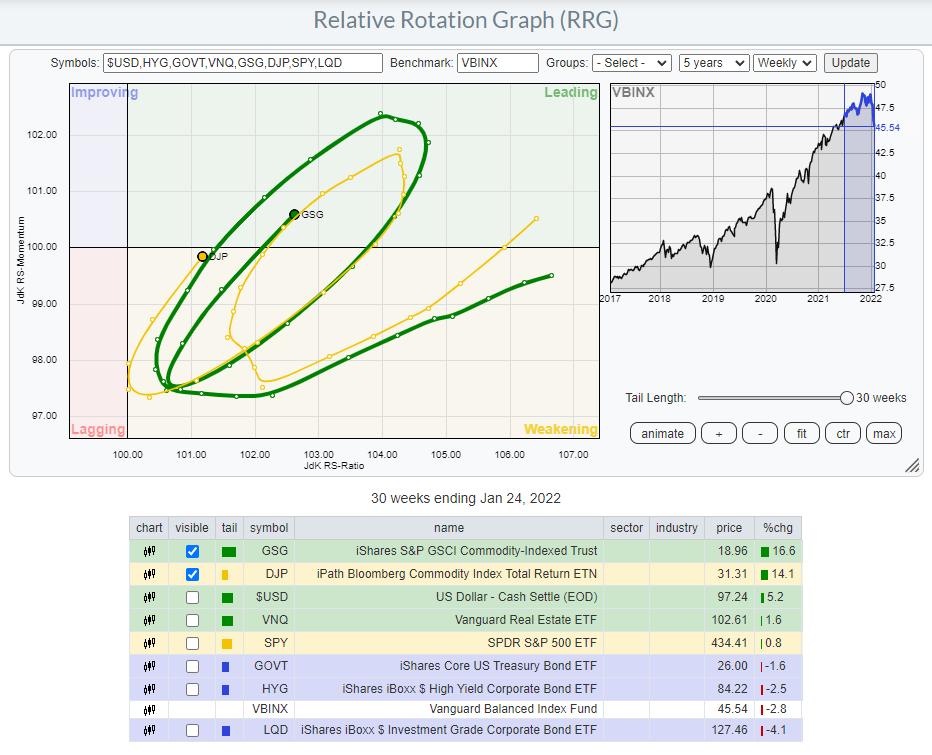
Once again, the DJP and GSG tails are entering the leading quadrant from weakening, underscoring the strong relative uptrend that is going on.
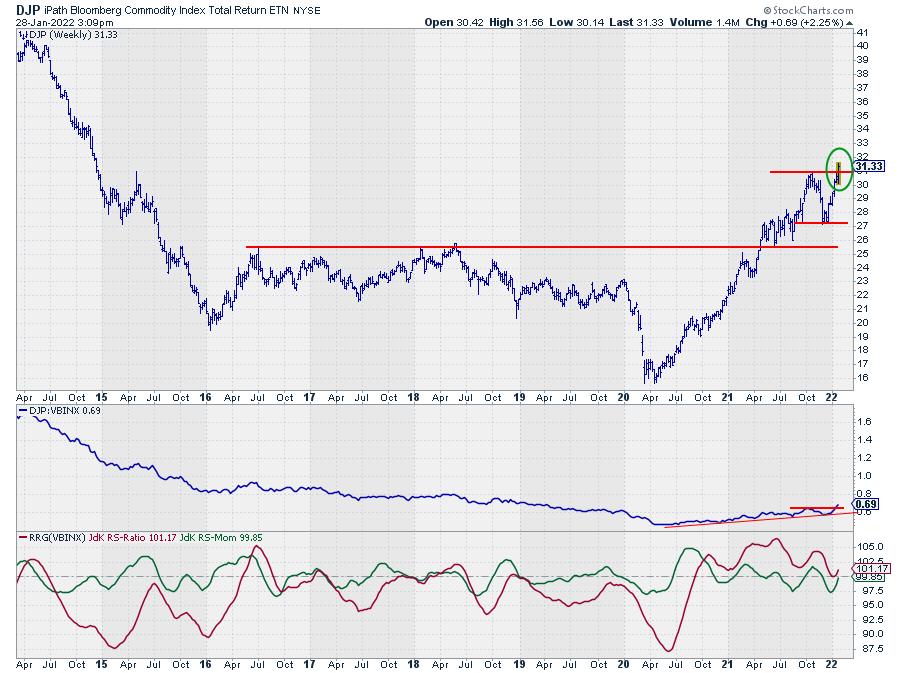
DJP
GSG
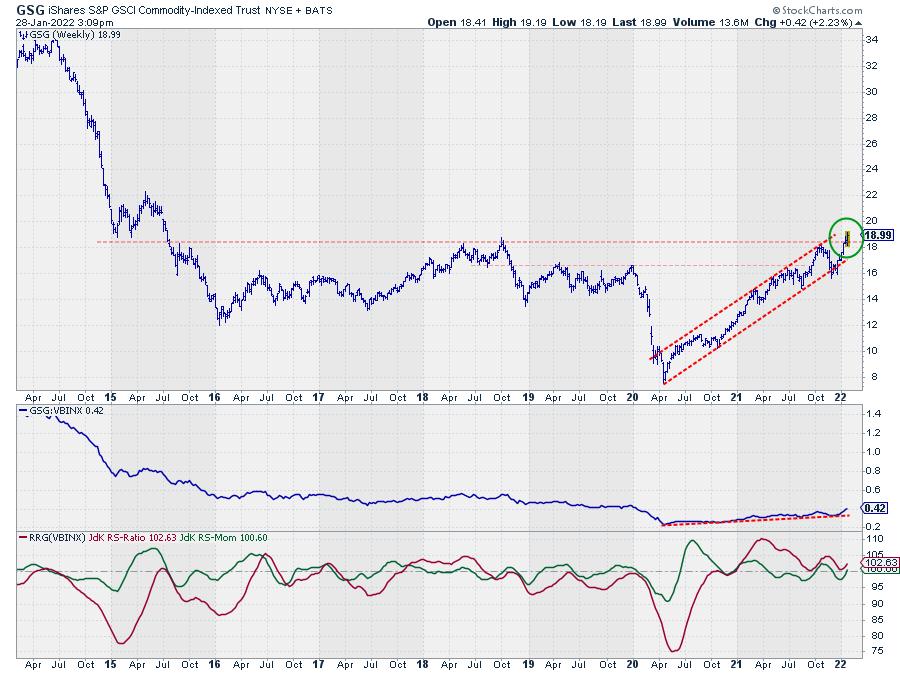
Both DJP and GSG are showing breakouts above major resistance levels this week, which opens up the way for much more upside movement in this asset class.
In the drop-down list on the RRG page, we also have an RRG universe for Commodity groups that allows us to go into the breakdown of the commodity universe.
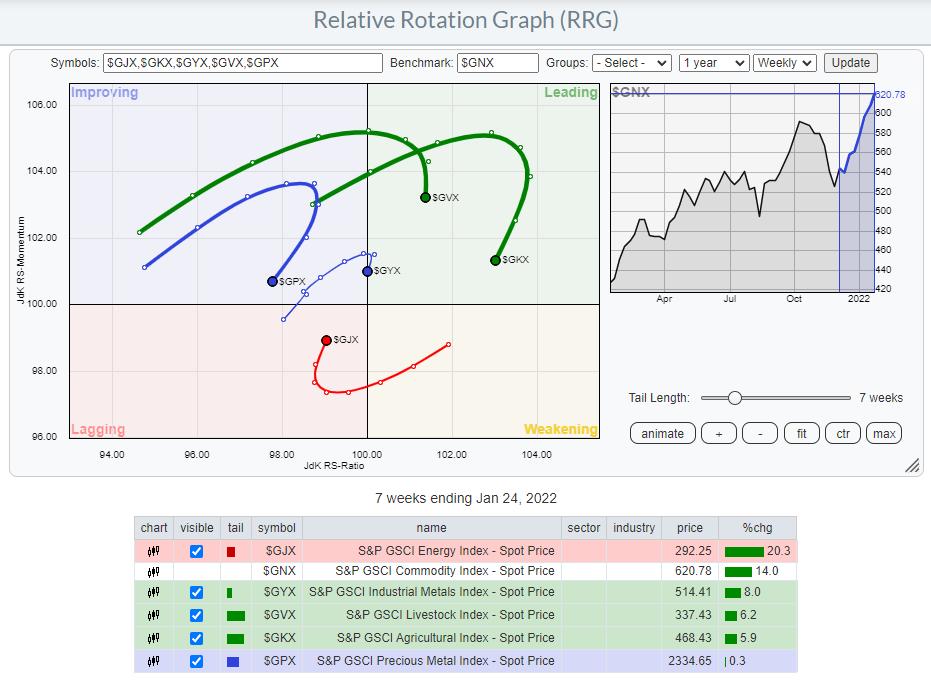
What we see here is an interesting rotation between the different commodity groups. The tails are seven weeks long and, at the moment, only $GJX (Energy) is turning back into the 0-90 degree heading, while all other groups are turning in the opposite direction. What this means is that, until now, the rally in commodities has been driven by all groups except energy. That is now changing.
It looks as if Energy will be the group driving the next wave higher for commodities.
S&P GSCI Energy Index
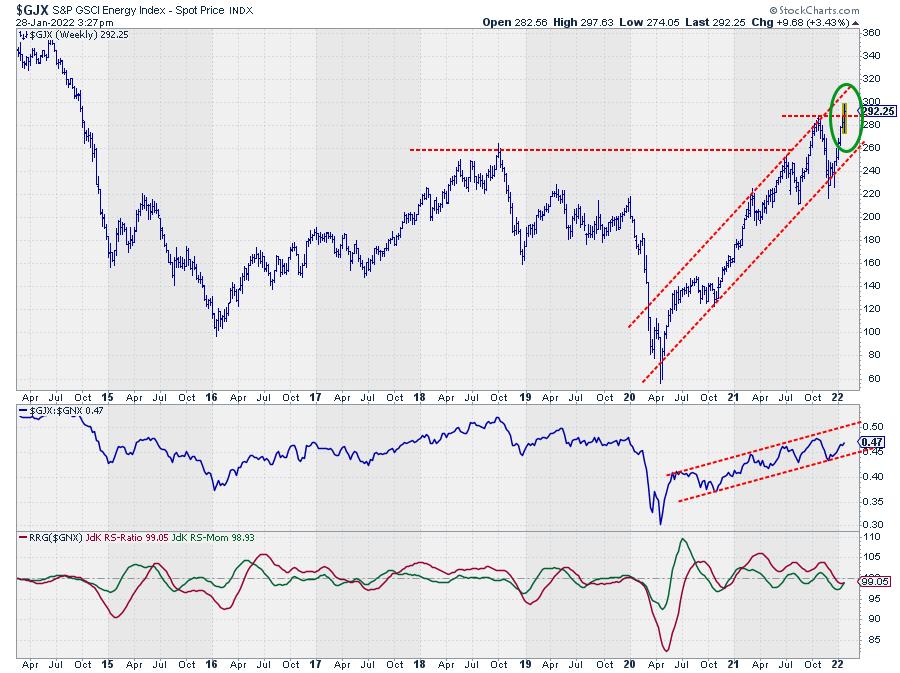
The price chart of the underlying Energy index is supporting such a rotation, as it is just taking out its previous high and setting up to continue its rally higher. Making a connection to the stock market brings us to the chart of the Energy sector index.
XLE
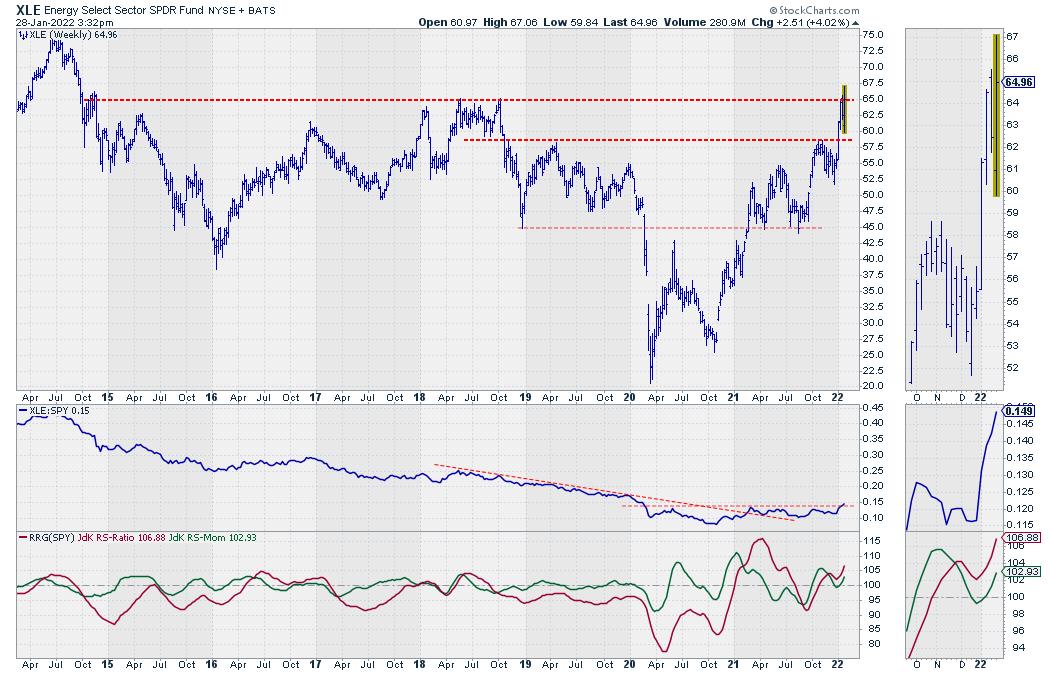
Here, we also see an attempt to take out a major overhead resistance level. This week, it was too much and XLE failed just short of 65.
When $GJX will be able to follow through on this week’s upward break, it seems only a matter of time before XLE will follow in its tracks and push higher as well.
#StaySafe and have a great weekend, –Julius
My regular blog is the RRG Charts blog. If you would like to receive a notification when a new article is published there, “Subscribe” with your email address.