Today is Friday; however, when the markets drew to a close on Thursday, it left both major events behind itself while it also navigated the weekly options expiry. The markets are having an immensely volatile week; with the last trading day of the week yet to unfold, the weekly bar isn’t complete yet. However, that being said, the major volatility infusing events; i.e., the Union Budget which is one of the most important domestic events, and the Fed Rate announcement, is out of the way.
Amid these volatile times, there were pockets of stocks, independent of the sectors that they belonged to, that were showing very resilient performance. This Commercial Vehicle maker is one such example. The entire Auto sector was seen underperforming the broader markets in the recent past. However, that pocket is now showing strong improvement in its relative momentum against the broader NIFTY 500 Index.
Ashok Leyland Ltd (ASHOKLEY.IN)
This midcap auto stock marked its high point at 169.45 in early September 2022; since then it saw a corrective retracement and has formed a broad but defined trading range for itself. With the quarterly results out of the way, barring some result reactions, the stock is expected to see higher levels over the coming days.
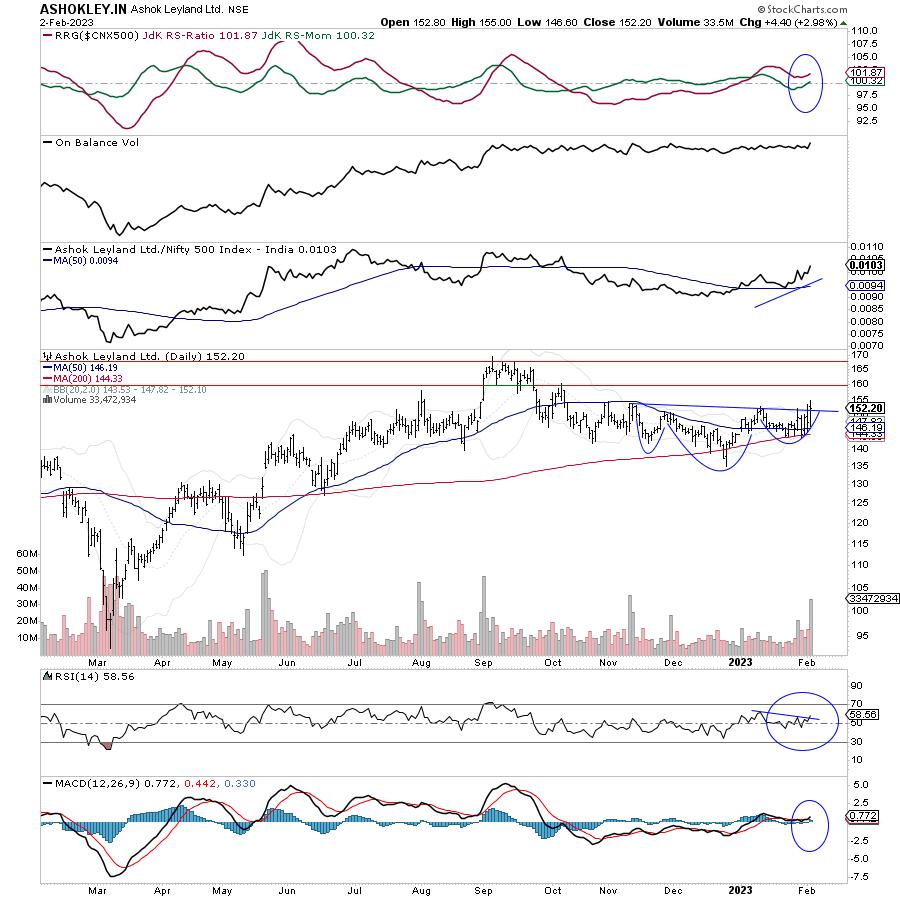
After marking the high at 169.45, the price moves over the past quarter price moves have seen a development of a bullish (Inverted) Head & Shoulders formation. As the price tries to break out, it is also seen resisting the 100-DMA which is almost acting as a proxy neckline for this formation. While this formation was taking shape, the stock also took support for multiple times at 200-DMA which presently stands at 144.
While the stock attempts a breakout, it has rolled inside the leading quadrant. This lends further impetus to the current relative outperformance of the stock. The RS line against the broader NIFTY 500 index is also in a firm uptrend and above the 50-period MA.
There is strong volume participation in the move as well. While the stock is seen attempting a breakout, the volumes are already higher than their average; the On-Balance Volume (OBV) has also marked a new high which is bullish. The MACD has shown a positive crossover; it is now bullish and trades above the signal line. The RSI is seen breaking out of a formation by penetrating a falling trend line; this comes ahead of the actual price breakout. It also shows a bullish divergence against the price along with marking a fresh 14-period high.
The stock is likely to continue to relatively outperform not only the Auto sector but also the broader markets and the mid-cap universe. The stock has the potential to test 160-165 levels over the coming days. Any close below 142 would negate this technical setup.
and
Milan Vaishnav, CMT, MSTA | Consulting Technical Analyst | www.EquityResearch.asia | www.ChartWizard.ae