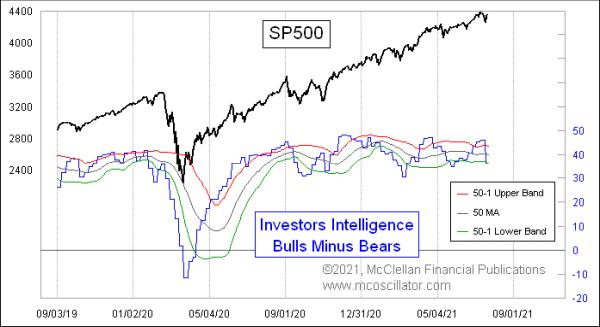
A big selloff on Monday, July 19, 2021 brought a big sentiment reality check for a lot of investors, who were glad to part company with their stocks on a day that saw the DJIA fall by 726 points. Then they got the chance to regret that decision the next day, when prices rallied back and recovered most of those losses.
There is nothing like price movement to affect sentiment. In this case, we can see the effect on sentiment by looking at the Investors Intelligence survey data, just out late in the evening on Tuesday, July 20 and, thus, reflecting changes in the opinions of investment advisors and newsletter writers in the wake of the July 19 selloff. Bears were little changed, rising slightly from 15.3% to 16.7%. But bulls had a big drop, from 61.2% a week before to 53.1%.
That took the Bull-Bear Spread in this week’s chart from 45.9 to 36.4, a drop of 9.5 percentage points. It is a pretty big one-week drop, with the Bull-Bear Spread down from above the upper 50-1 Bollinger Band to below the lower one all in just one weekly change.
This much of a drop in sentiment should not be a big surprise, given the drop in price. In past articles here, I have noted how the movements of the Investors Intelligence numbers are very well explained by movements in prices. Here to help illustrate that is a comparison of the Bull-Bear Spread to a detrended plot of the DJIA. Note the close correlation:

Notice in this chart that, to get a proper overlay of the data, I had to use offset y-axes. That is a fancy way of saying that the Investors Intelligence survey data have about a 20 percentage point bias to the bullish side. This is perhaps appropriate, given that the stock market tends to trend higher in the long run. It is nice to see a way to quantify just how much that bias represents in the data.
Big weekly changes in these sentiment survey numbers contain important information. The 9.5 percentage point drop in the Bull-Bear Spread is one of the larger weekly changes. Here is what those weekly changes look like:

Most of the time, when there is a one-week drop of greater than about 7 percentage points, it is a pretty good marker of a meaningful price bottom. You will notice, however, that, during the COVID Crash, things were different, with prices and sentiment falling several weeks in a row. That is not how it works most of the time, but a pandemic will do funny things to the markets — and to sentiment. If the most recent dip is going to be another event like the COVID Crash, then it may not end up marking a meaningful bottom for prices.
But if it is showing us a more typical situation, then we have just seen a nice scary selloff that worked to do the job of frightening investors away.