
The Relative Rotation Graph for US sectors shows an interesting clustering of sectors close to the benchmark at the start of this week.
I have highlighted this cluster in the RRG above. The chart below zooms in on those three sectors that are more or less overlaid on each other at the same spot on the RRG at the moment.
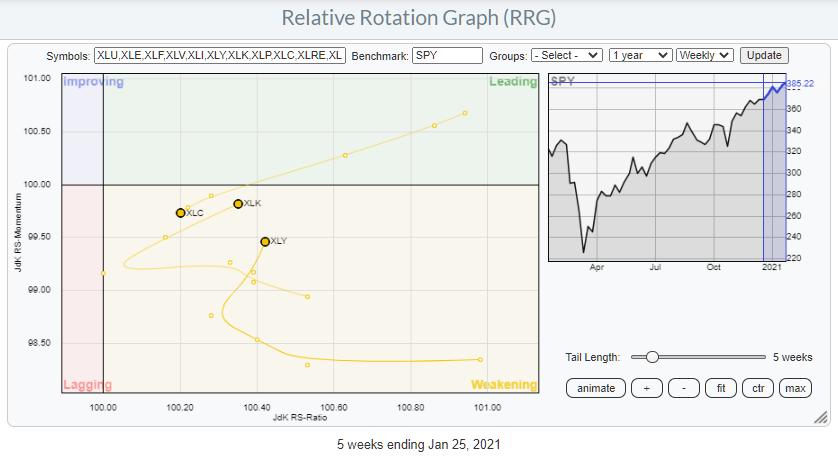
Here we can see more detail and actually see which sector we are talking about. The sectors at and are Communication Services (XLC), Consumer Discretionary (XLY) and Information Technology (XLK).
And although they are positioned very close together in the same area on the RRG, they did not all get there in a similar fashion and they are not showing a similar trajectory on their tails.
The two sectors I want to deal with in this article are XLC and XLK.
Communication Services
Communication Services is actually travelling at a negative RRG-Heading and moving towards the lagging quadrant which makes it the least interesting of the three for the time being.
In my discussion of this sector in Sector Spotlight earlier today I mentioned that the (price) chart itself isn’t even all that bad. Price broke to new highs and is confirming the uptrend. What is lacking at the moment is relative strength vs SPY.
While the tail is still at the right hand side of the RRG, inside the weakening quadrant, albeit only just, there is still the possibility for this sector to turn back up and move back towards leading. The length of the XLC tail is relatively short when compared to other sectors which makes it easier to turn around and indicates that the momentum behind the current move is not particularly strong.
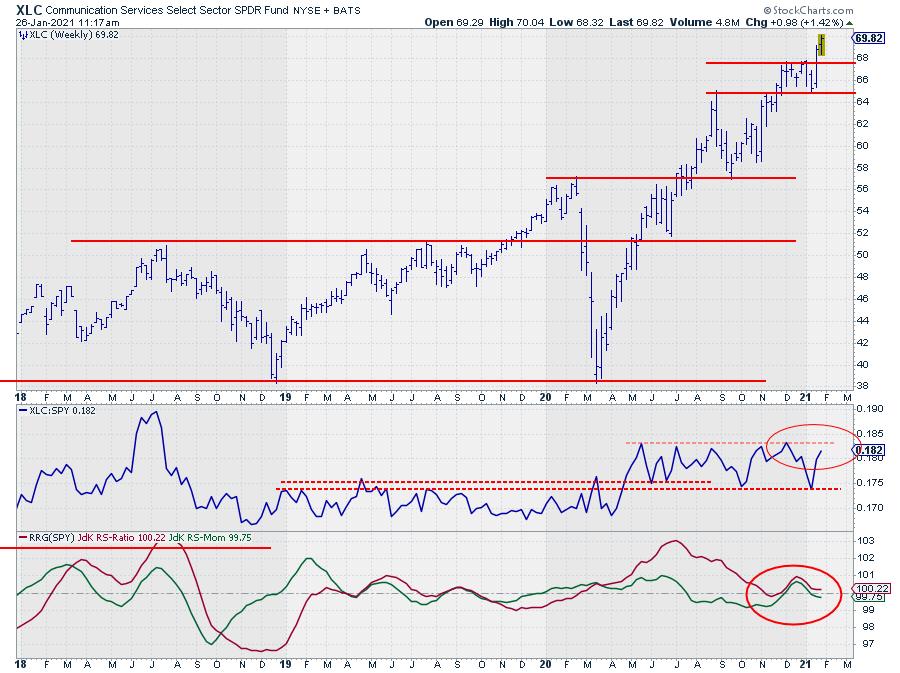
What is needed for XLC to get back into the leading quadrant is a break of the relative strength line above the horizontal barrier that has been put into place since May 2020.
Information Technology
XLK rotated into the weakening quadrant in July last year after a very strong rotation through leading. Looking at the price chart in combination with relative strength we can see why. Since July/August the RS-Line is captured inside a narrow range.
This means that the performance has been more or lees in-line with the S&P 500. This drop-off in relative momentum has caused the JdK RS-Momentum line to decline below 100 and dragging the JdK RS-Ratio line lower with it.

The break to new highs in price has paved the way for a continuation of the longer term uptrend and it looks as if the RRG-Lines are trying to put in a new low and start moving higher in tandem. This would push the tail back into the leading quadrant and start a new leg of the uptrend in relative strength as well.
However we do need a break out of the range in relative strength for this move to really materialize and work out as expected.
When we talk about the Technology sector, we talk about Apple which counts for 24% of the sector. And AAPL seems to be coming to life again.
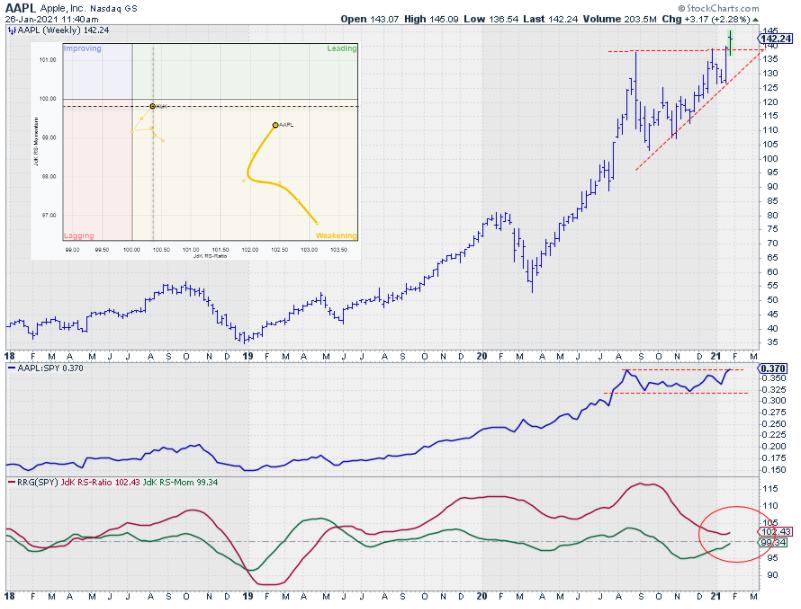
Here you see the current break to new highs in price which is underway as we speak. It is a weekly chart so the last bar only holds prices until mid-day on Tuesday. So not final yet but unless we get a sharp reversal back below the breakout level, things start to look pretty good for AAPL again.
The small RRG shows AAPL and XLK together on one RRG against SPY. I call this a “double benchmark” RRG as you are able to spot the rotation of one (or more) stocks against the sector benchmark (XLK) as well as the broader market benchmark (SPY) in one graph.
And what we see here is the improvement of XLK vs SPY as discussed already above. But also the rotation of AAPL, inside the weakening quadrant, curling back up and heading back towards leading against both XLK and SPY.
The other big gun in the sector is MSFT. Although not as strong as AAPL, yet, in terms of relative strength it is also breaking higher from a consolidation.

With 44% of the market capitalization in the sector breaking away from consolidations and both tails moving at an RRG-Heading between 0-90 degrees. It looks as if
(BIG) Tech is Back on Track
#StaySafe, –Julius