 A consistent imperfect routine is way better than an inconsistent perfect routine.
When I’ve worked with investors that are new to technical analysis, I often find that they spend too much time trying to perfect their analytical approach on a particular chart, and way too little time determining which chart they should be looking at in the first place!
Over the years, I have learned from mentors on how they go about analyzing markets, and what strikes me is the diligent process of following a set routine. Every day I do XYZ, every week I do ABC, and so on.
I developed a “morning coffee routine” that I first started years ago, when I was first learning technical analysis. I have added to and subtracted from the list over time as I have found new techniques and eliminated others.
Here are five observations on how I have set up my on morning coffee routine, which you can access from our list of ChartPacks.
First, we go from long-term to short-term. As a long-term investor, the worst thing I can do is look at short-term data and get caught up in the “flickering ticks” of the daily fluctuations. I want to prime my thinking for the long-term, which means I need to start with a long-term view of equities.
My first chart is a weekly S&P 500 chart using a Market Trend Model that I developed years ago, focused on weekly exponential moving averages.
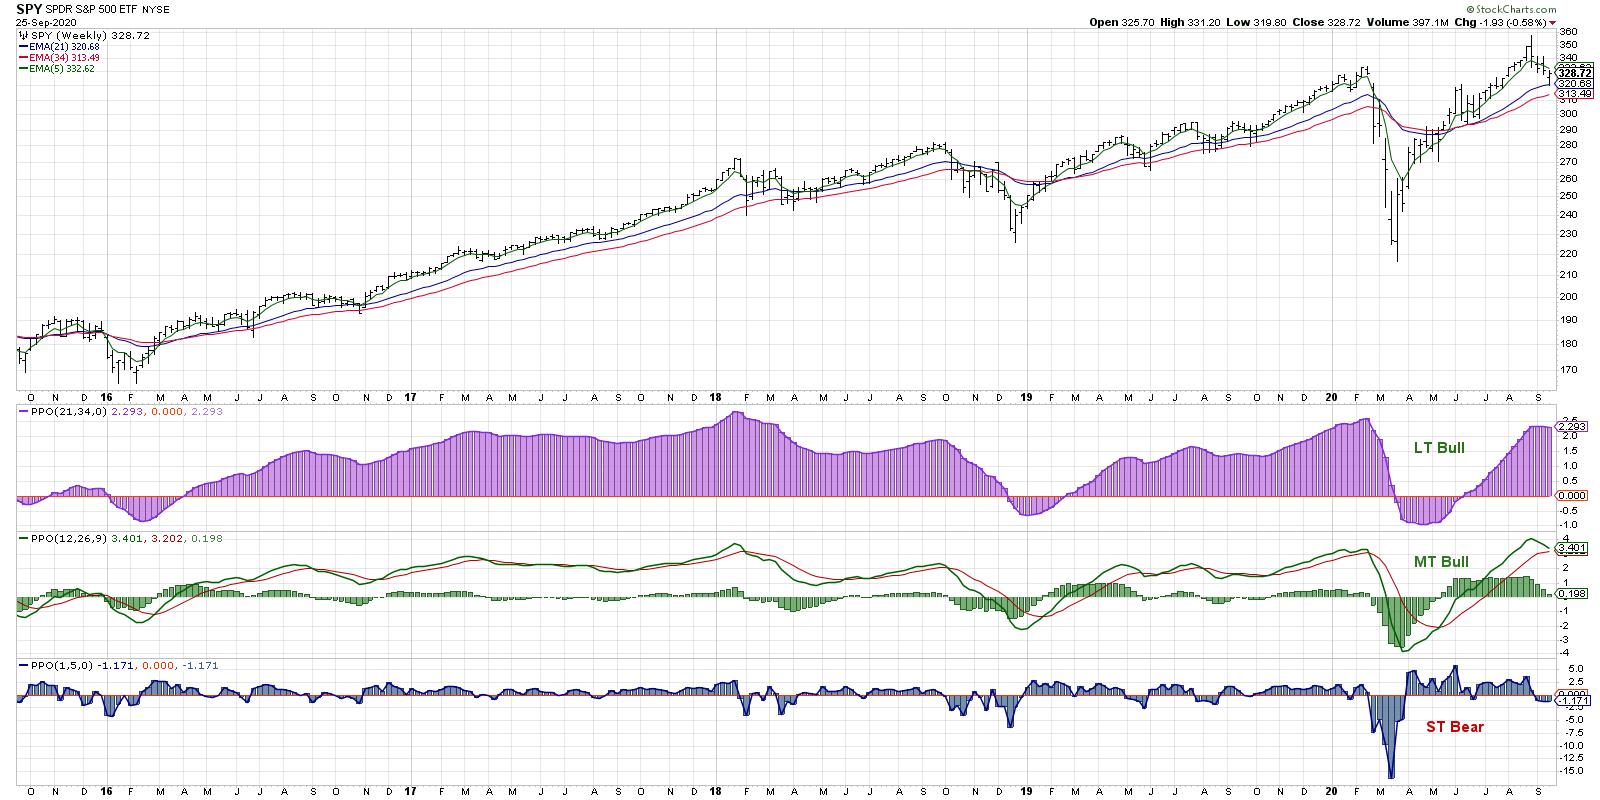
The long-term trend is defined by the 21- and 34-week EMA, while the medium-term trend is indicated by the weekly PPO using 12- and 26-week EMA. Thus, the first thing I focus on every day is, “What is the long-term trend in the market?”
Second, I go in order through the main steps of my macro process: Price, Breadth and Sentiment.
My next set of charts covers broad equity indices, global equity markets and intermarket analysis. I then dig into breadth indicators, to measure participation, and sentiment indicators, to gauge investor psychology and how that relates to the price trends.
For me, price is most important, with things like breadth and sentiment all serving to either confirm what I’m seeing in price or suggesting something may be amiss.
Third, I move on to sectors and try to determine where institutions are rotating their bets. Julius de Kempenaer’s Relative Rotation Graphs have been a staple of my sector work for years, and I still believe it’s one of the best ways to understand how institutions are allocating their bets between sectors and themes.
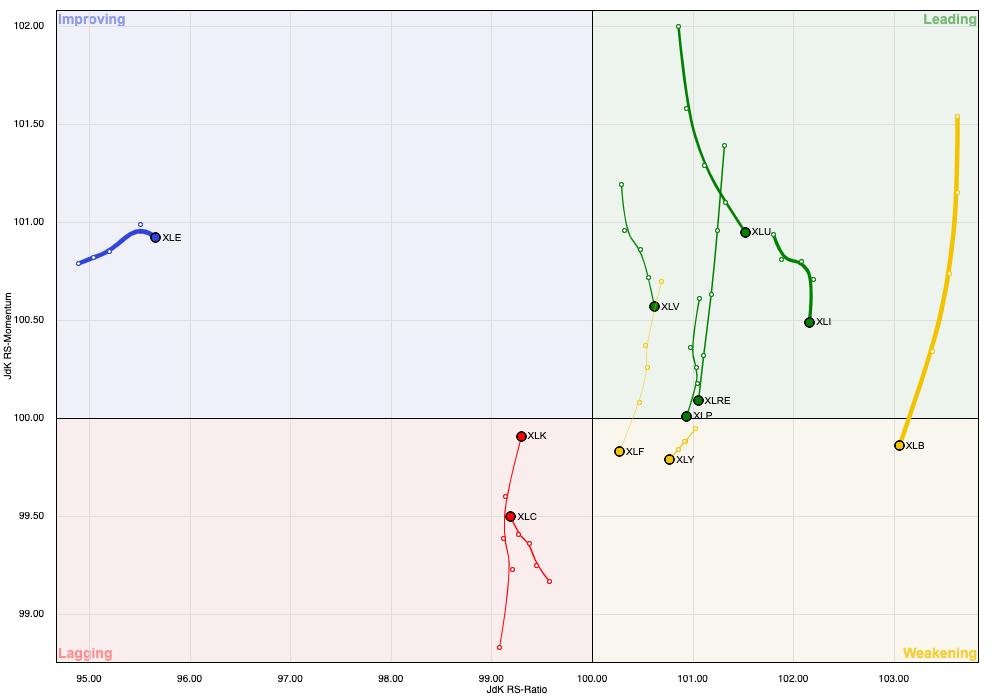
Recently, I’ve been focusing on the rotation out of mega-cap technology into materials and industrials, as well as the potential emergence of defensive plays like utilities. Between the weekly and daily RRGs, I feel I’m able to get a solid read on sector flows.
Fourth, I dig into individual stocks, usually starting with the 30 members of the Dow Industrials. I know it’s not an ideal benchmark for equity investors, but it does hit on many of the key names that I want to follow closely every day. This is also when I tend to run screens for stocks making new 13-week highs or 13-week lows, as this can indicate names in the early stages of a trend reversal.
Fifth, I take a look at my own portfolios, watch lists or client portfolios. Many investors incorrectly put this at the beginning of their process, checking their performance before they dig into all the other charts. By putting my own holdings/stocks/chart of interest at the end, I’m able to first determine what I think about the broad market landscape, then identify how I’m positioned relative to that investment thesis.
Am I positioned correctly for what I see as the most likely outcomes? What would I do given potential alternative scenarios? By starting with the broad market and finishing with my own holdings, I’m able to answer those questions much more effectively.
So there is a “behind the scenes” look at my daily process of reviewing the charts. You’re welcome to access these charts from our list of ChartPacks and check out my daily closing bell show, The Final Bar, as I often refer to many of the charts I’ve discussed in this article.
And now I’ll finish with the most important question – What’s your daily process?
RR#6,
Dave
David Keller, CMT
Chief Market Strategist
StockCharts.com
Disclaimer: This blog is for educational purposes only and should not be construed as financial advice. The ideas and strategies should never be used without first assessing your own personal and financial situation, or without consulting a financial professional.
The author does not have a position in mentioned securities at the time of publication. Any opinions expressed herein are solely those of the author, and do not in any way represent the views or opinions of any other person or entity.