Note: Several readers have asked why their state health department data doesn’t exactly match the CDC data for a given state. Sometimes the reason is a different denominator (total population vs. 12+ for example), sometimes the reason isn’t clear. These are questions for the state health departments. This data is from the CDC.
The 7-day average cases is the highest since February 2nd.
The 7-day average hospitalizations is the highest since February 9th.
The 7-day average deaths is the highest since April 24th.
According to the CDC, on Vaccinations.
Total doses administered: 359,623,380, as of a week ago 353,859,894. Average doses last week: 0.82 million per day.
| COVID Metrics | ||||
|---|---|---|---|---|
| Today | Yesterday | Week Ago |
Goal | |
| Percent fully Vaccinated |
51.1% | 51.0% | 50.4% | ≥70.0%1 |
| Fully Vaccinated (millions) |
169.6 | 169.2 | 167.4 | ≥2321 |
| New Cases per Day3🚩 |
133,055 | 130,562 | 116,740 | ≤5,0002 |
| Hospitalized3🚩 | 76,077 | 74,755 | 62,230 | ≤3,0002 |
| Deaths per Day3🚩 | 640 | 586 | 578 | ≤502 |
| 1 Minimum to achieve “herd immunity” (estimated between 70% and 85%). 2my goals to stop daily posts, 37 day average for Cases, Currently Hospitalized, and Deaths 🚩 Increasing 7 day average week-over-week for Cases, Hospitalized, and Deaths ✅ Goal met. |
||||
IMPORTANT: For “herd immunity” most experts believe we need 70% to 85% of the total population fully vaccinated (or already had COVID).
KUDOS to the residents of the 7 states that have achieved 60% of total population fully vaccinated: Vermont at 67.2%, Massachusetts, Maine, Connecticut, Rhode Island, Maryland and New Jersey at 60.1%.
The following 17 states and D.C. have between 50% and 59.9% fully vaccinated: New Hampshire at 59.1%, Washington, New York State, New Mexico, Oregon, District of Columbia, Virginia, Colorado, Minnesota, California, Hawaii, Delaware, Pennsylvania, Wisconsin, Florida, Nebraska, Iowa and Illinois at 50.1%.
Next up (total population, fully vaccinated according to CDC) are Michigan at 49.7%, South Dakota at 48.2%, Ohio at 47.5%, Kentucky at 47.1%, Kansas at 46.8%, Arizona at 46.6%, Alaska at 46.5%, Utah at 46.3%, and Nevada at 46.3%.
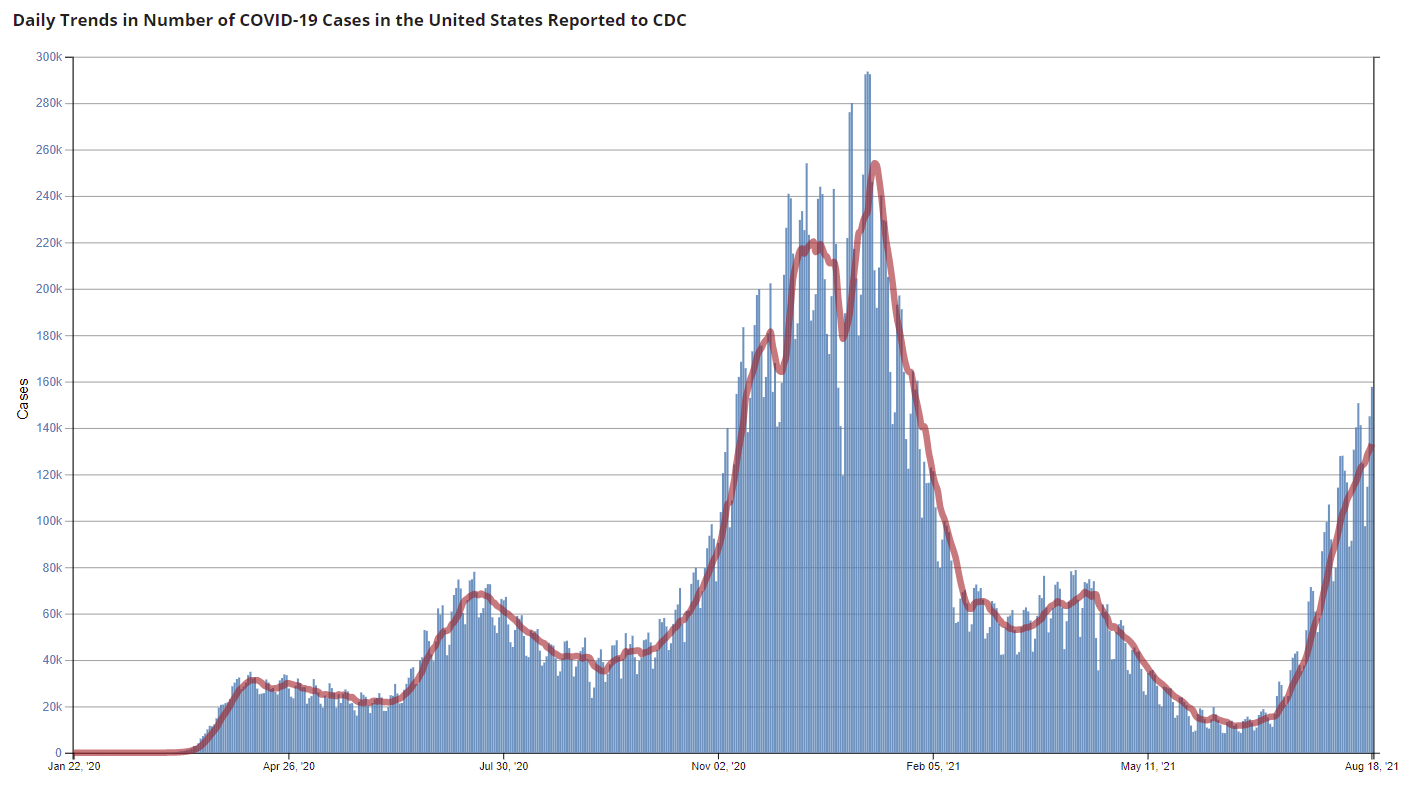 Click on graph for larger image.
This graph shows the daily (columns) and 7 day average (line) of positive tests reported.
This data is from the CDC.