Congratulations to the residents of California and Pennsylvania on joining the 80% club! Go for 90%!!! (80% of adults have had at least one shot).
 Click on graph for larger image.
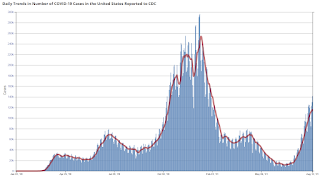
The 7-day average cases is the highest since February 6th.
The 7-day average hospitalizations is the highest since February 15th.
The 7-day average deaths is the highest since May 19th.
This data is from the CDC.
According to the CDC, on Vaccinations.
KUDOS to the residents of the 21 states and D.C. that have achieved the 70% goal (percent over 18 with at least one dose): Vermont, Hawaii, Massachusetts, Connecticut, Maine, New Jersey, New Mexico, Rhode Island, Pennsylvania, California are at 80%+, Maryland, Washington, New Hampshire, New York, Illinois, Virginia, Delaware, Minnesota, Oregon, Colorado, Florida and D.C. are all over 70%.
Total doses administered: 354,777,950, as of a week ago 349,787,479. Average doses last week: 0.71 million per day.
| COVID Metrics | ||||
|---|---|---|---|---|
| Today | Yesterday | Week Ago |
Goal | |
| Percent over 18, One Dose✅ |
71.6% | 71.5% | 70.6% | ≥70.0%1,2 |
| Fully Vaccinated✅ (millions) |
167.7 | 167.4 | 165.9 | ≥1601 |
| New Cases per Day3🚩 |
116,508 | 114,208 | 100,981 | ≤5,0002 |
| Hospitalized3🚩 | 64,231 | 62,117 | 47,709 | ≤3,0002 |
| Deaths per Day3🚩 | 514 | 491 | 424 | ≤502 |
| 1 America’s Short Term Goals, 2my goals to stop daily posts, 37 day average for Cases, Hospitalized, and Deaths 🚩 Increasing 7 day average week-over-week for Cases, Hospitalized, and Deaths ✅ Short term goal met (even if late). |
||||
KUDOS to the residents of the 21 states and D.C. that have achieved the 70% goal (percent over 18 with at least one dose): Vermont, Hawaii, Massachusetts, Connecticut, Maine, New Jersey, New Mexico, Rhode Island, Pennsylvania, California are at 80%+, Maryland, Washington, New Hampshire, New York, Illinois, Virginia, Delaware, Minnesota, Oregon, Colorado, Florida and D.C. are all over 70%.
Next up are Utah at 69.7%, Nebraska at 68.9%, Wisconsin at 68.6%, Kansas at 68.1%, South Dakota at 67.8%, Nevada at 67.6%, Texas at 67.5%, and Iowa at 67.1%.
 Click on graph for larger image.
This graph shows the daily (columns) and 7 day average (line) of positive tests reported.
The current wave is already the second worst for cases although there was limited testing during the first wave.