At EarningsBeats, we’ve been trying to tell anyone willing to listen why the stock market is going higher. I was definitely among the tiny minority back in March and April when I suggested that this downturn was a cyclical bear market within a secular bull market. I think a lot more folks probably agree with me now. It’s so important to be able to take a step back and look objectively at the stock market when chaos is all around you. And since March, we’ve certainly seen our share of chaos. Ignore the media reports as we all know click bait headlines is their schtick. Focus on the charts. Do your homework. Have a plan and stick to it.
I developed my Strong Earnings ChartList back in 2013 and I still trade almost exclusively off of it. It just makes really good common sense to me. Companies that are growing their earnings and beating Wall Street consensus estimates as to both revenues and EPS have management teams that are executing their business plans. Shouldn’t we admire and be attracted to businesses capable of doing that. When I coached girls softball, I always set my lineup with a certain strategy in mind. That strategy could change depending on the opponent and their strengths/weaknesses, but I always planned ahead in order to gain (or try to gain) a competitive advantage. If my plan was sound and the girls executed the plan, we generally won. It’s honestly no different in business. Put your money to work for companies that have sound plans, execute them to perfection, and win. Winning shows up in relative strength in the stock market.
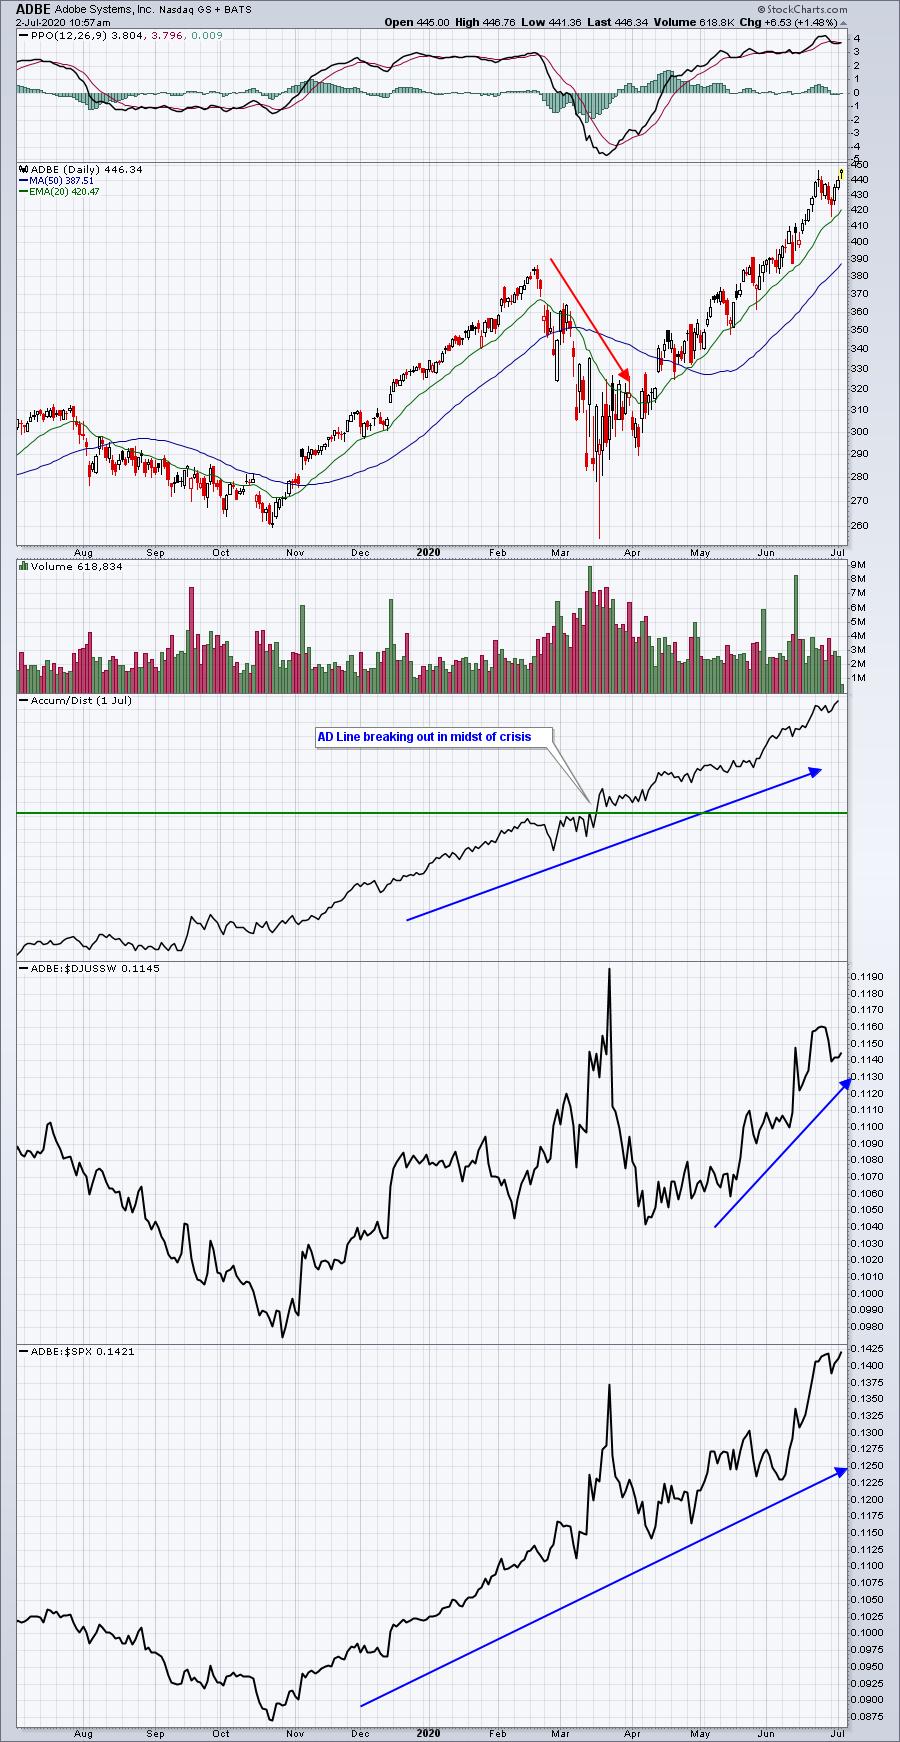
Conditions changed back in late-February and throughout March and April. We needed to change with them…..and we did. We developed new ChartLists to complement our Strong Earnings ChartList. So many stocks were unfairly shorted, resulting in massive short % of float on dozens of companies. We now have a Short Squeeze ChartList so that our members will know when stocks are breaking out with tons of short interest. In March/April, we developed two ChartLists to distinguish between stocks that were being accumulated and stocks that were being distributed as a result of the pandemic. Coincidentally, they’re our Strong AD ChartList and Weak AD ChartList. Very early during this crisis, I realized that nearly every stock was gapping lower to start the trading day, but after the open, there were clear divergences. Many stocks were rising throughout the trading day, while others continued their descent. The accumulation/distribution line (AD Line) was, in my opinion, THE most useful indicator available to us. Let me show you two charts so that you can visualize the difference:
ADBE (from our Strong AD ChartList):
MTSC (from our Weak AD ChartList):
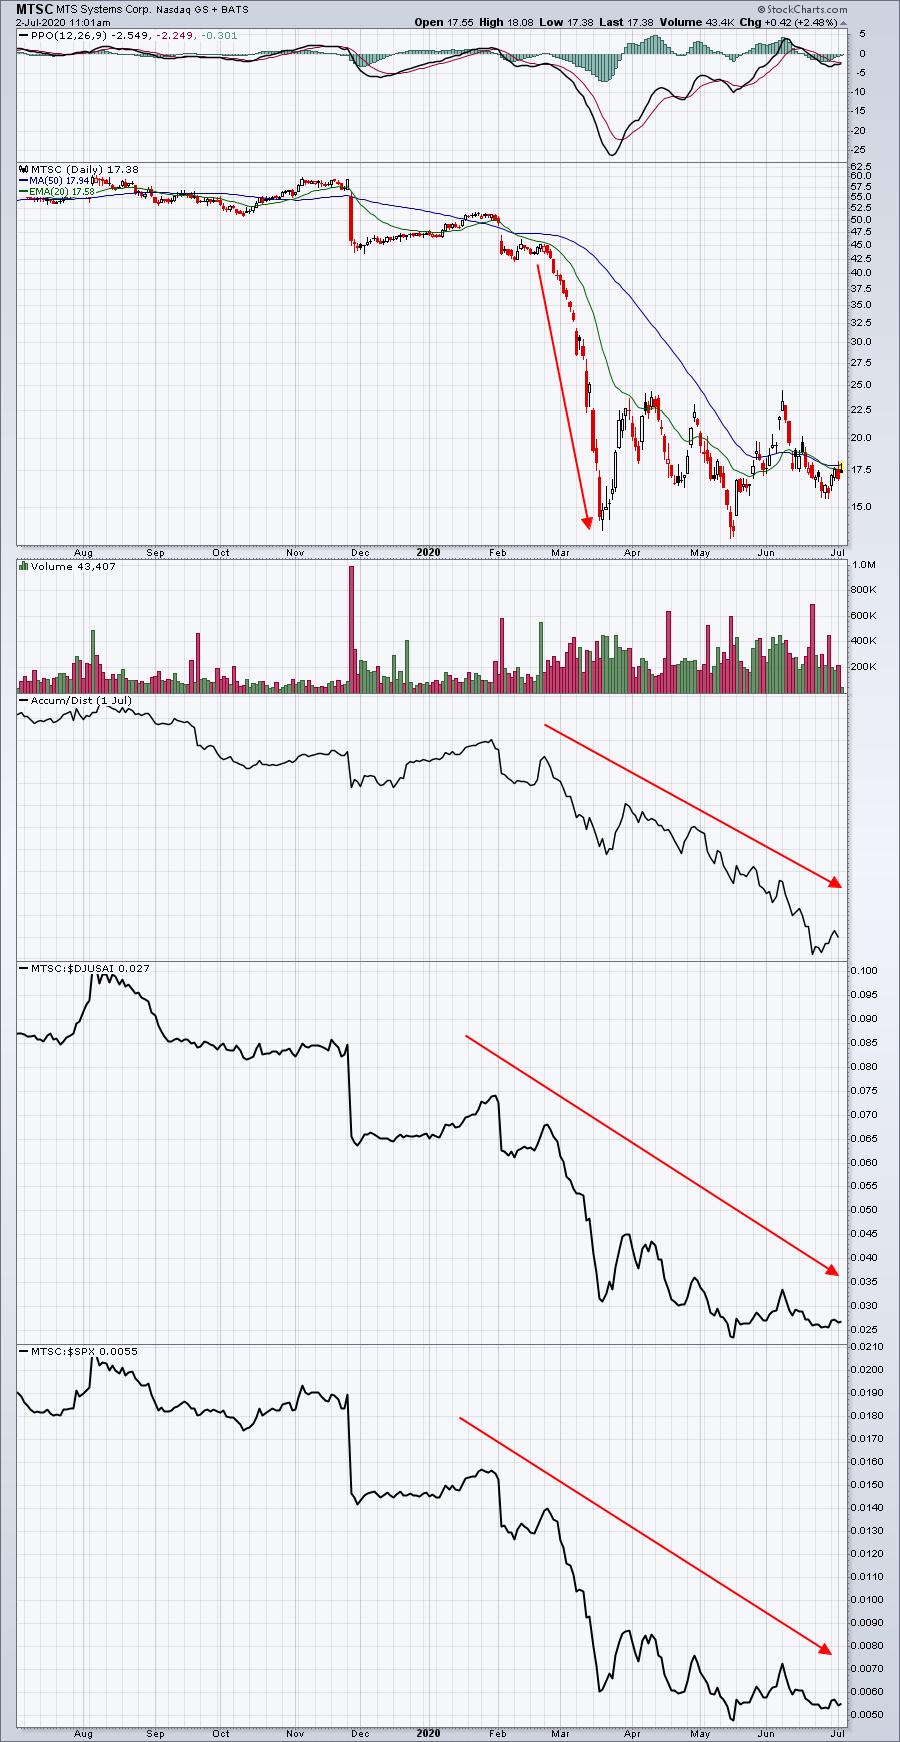
These are two extremes, but highlight the divergence that took place back in March. ADBE showed many gap downs on its chart, similar to MTSC. But ADBE was rallying during many of the trading days back in March and April, resulting in hollow candlesticks. MTSC was seeing very little of that. Wall Street professionals were dumping stocks like MTSC and accumulating stocks like ADBE. And the rest is history, as you can see from the charts.
I used that information, in large part, in establishing our portfolios back on May 19th. We redesign our portfolios every three months on February 19th, May 19th, August 19th, and November 19th. The timing is such that most companies have reported quarterly earnings by those dates. Each portfolio is comprised of 10 equal-weighted industry-leading stocks in 10 different and top performing industries. Here’s our performance quarter-to-date (since May 19th) on each portfolio, compared to the benchmark S&P 500:
S&P 500: +6.60%
Model Portfolio: +21.34%
Aggressive Portfolio: +7.99%
Income Portfolio: +6.49%
Strong AD Portfolio: +12.19%
Not only has our performance been strong this quarter, but our Model Portfolio is now +103.77% in the 19 months since its inception on November 19th, 2018. The S&P 500 is +15.80% over that same time frame.
It’s imperative to own leading stocks in leading industries if you want to outperform the benchmark S&P 500. Prior results never guarantee future results, but I’m a believer in our relative strength strategy.
I know many of you probably don’t understand why the U.S. stock market is going higher. You might think it’s a house of cards, on the brink of a collapse. I don’t believe that at all. In fact, I believe the best is yet to come. On Monday, July 6th at 4:30pm ET, I will be hosting our “2020 2nd Half Market Outlook”. I’ll be discussing topics to include the BIG picture and where I see the major averages heading, sentiment analysis, and sectors, industries, and stocks to benefit from an upcoming price earnings (PE) explosion. It’s a members-only event, but a trial subscription gets you in the door. Currently, we have a fully refundable $7 30-day trial that you can take advantage of.
I hope to see you there!
Tom