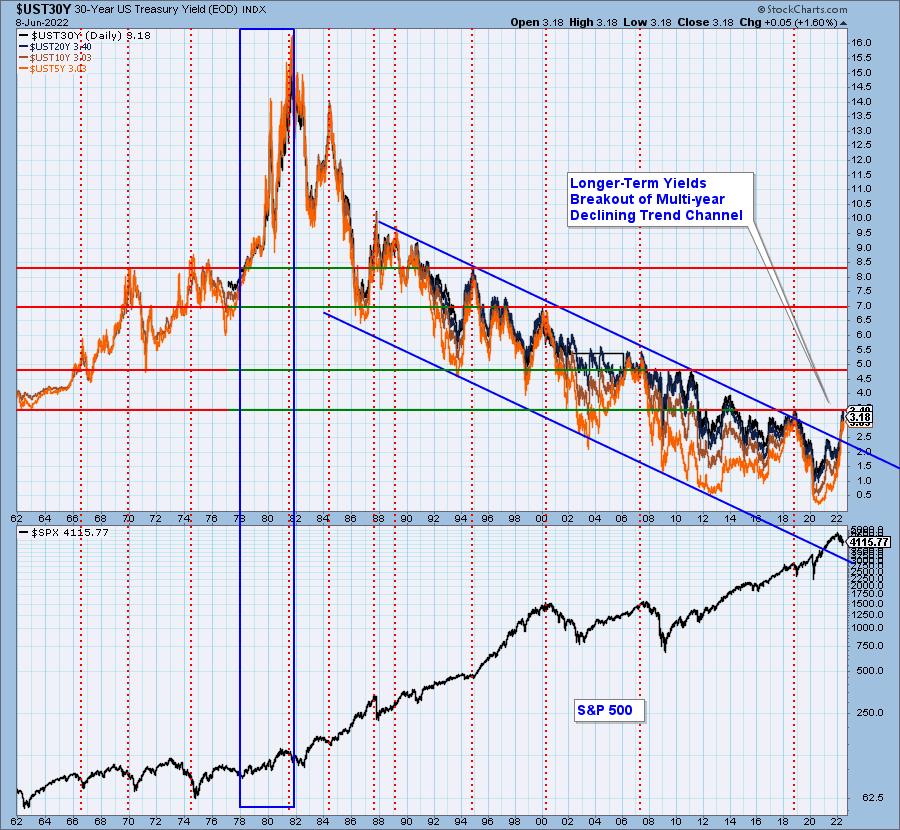
It’s been trending on social media that it is time for yields to top. One of the charts in the DPA ChartList (available to subscribers of DecisionPoint.com Blogs) is a long-term yield chart. The chart in the ChartList includes 1-yr yield on up to the 30-year yield, but we’ve trimmed it down to the 5/10/20/30-year yields.
Looking at the chart below it is hard to imagine we are going to see a major top in yields. Yes, they are up against overhead resistance from 2019, but this strong breakout from a declining trend channel that has been in place since the 1990’s is troublesome. Most importantly, we would point you to the period between 1978 and 1981. The economy was experiencing many of the same problems we have now. High inflation, high oil prices, housing prices soaring higher, etc. We’re not saying that we will see yields move up to 16%, but what is occurring today is not an historic precedence.