As we approach the end of June it’s a good time to look back over the market to see what has been happening.
The price action is in the bottom right corner of the charts whereas at the end of 2021, it was in the top right corner of the charts. Who could have seen the problems coming?
I think the technical analysis arena did an excellent job of showing the risks for downside momentum to increase.
On December 17th, I recorded a video about the technical problems aligning in the market and how they created the situation for a rough start to 2022.
A historical look back
In six month increments, it is an educational look back on what has been happening.
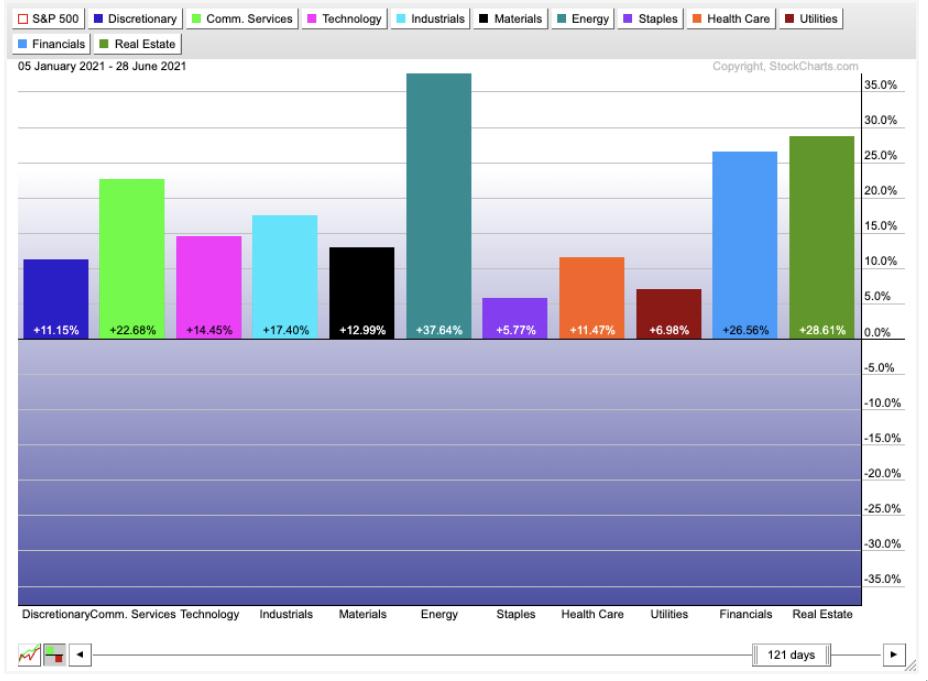
June 2021
Starting in June 2021, we came off the effervescent high of the SPAC boom. As the book Reminiscences of A Stock Operator highlights so clearly, when there is an abundance of money trying to enter the market, the bankers will respond with new offerings. Nowadays, venture capitalists have all the data they need to be ready to hand over these companies at lofty valuations and step aside for the downside slide. By June 2021, the SPAC announcements had slowed to a relative crawl compared to the 4th quarter of 2020 and the first quarter of 2021.
The defensive side of the market was out of favour, still showing positive returns to their investors, but vastly underperforming. Energy raged forward as the vaccines were rolling out, suggesting the economy would surge with post pandemic freedom. More on that later. Real Estate and financials were on fire. Interestingly, the growth areas of discretionary, communications and technology were middle of the pack.
December 2021
As the second half of 2021 rolled in, the market changed significantly. Communications and industrials vastly underperformed everything. Technology was back to a glory story, while discretionary and real estate continued to flourish. Financials were in the bottom third. Materials, energy and defensive names were middle of the pack.
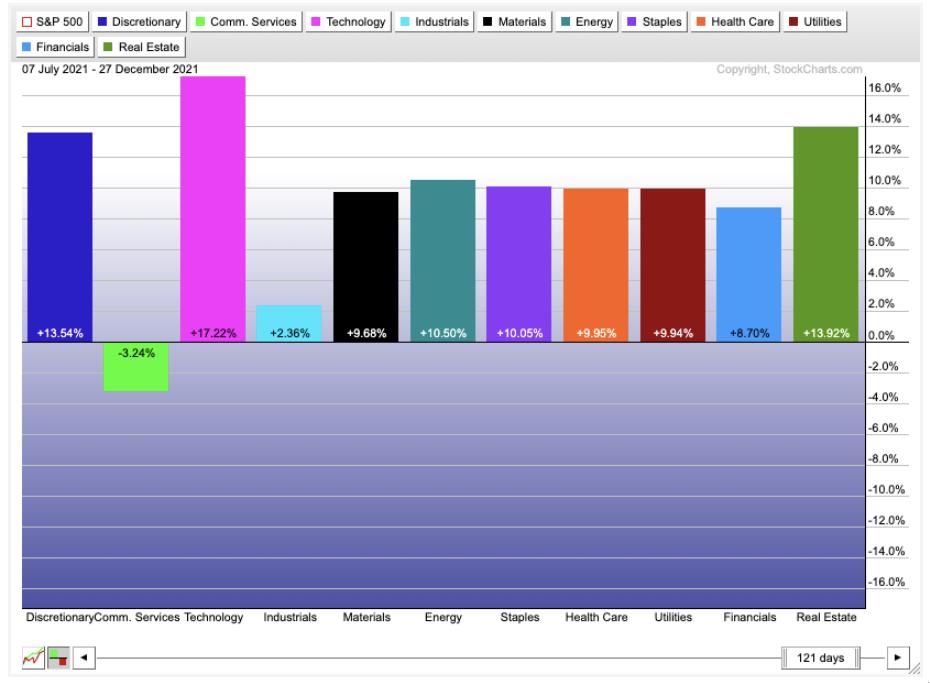
By late December, we were also narrowing our focus on the Sexy Six large cap names that kept holding up while there was a large breakdown in many of the trendy areas of the market. We didn’t know it at the time, but the November high in the Nasdaq was behind us. The move to electric cars and the investment theme around them came and went. Copper made a high in May 2021 and most of the metals moved sideways for the remainder of the year. Oil continued its steady climb in a big bull market that kicked off with the vaccine announcements fourteen months prior.
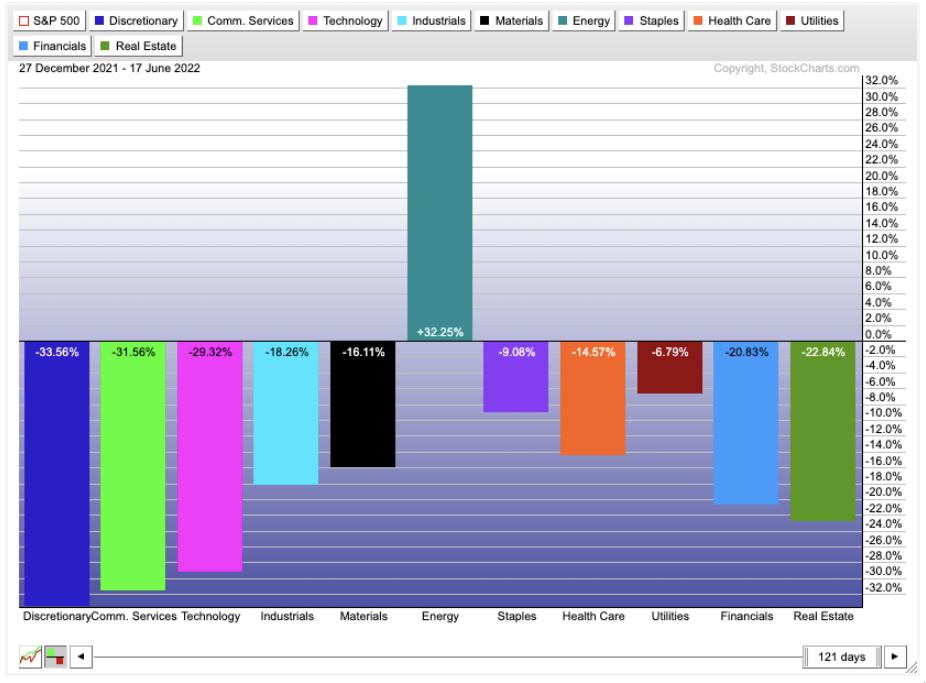
June 2022
As we turned the corner into 2022, almost all of the upward momentum was focused in energy. Technology stocks including semiconductors and software moved down meaningfully as the sexy six slowly let go. Alphabet, Meta and Amazon were the early leaders to the downside. Consumer discretionary and communications dropped hard.
By the end of June, the continuous slow demise of investors love for the technology space came to the fore. By March, investors were touting the start of a new bull market in Energy. After a 1000% gain in the oil and coal stocks, the relative strength community reluctantly decided it was a new bull market in fossil fuel energy. You can’t make that stuff up! Still, the technology investment community has been reluctant to dive into the dark side. While the tiger cubs watched 50% of their asset valuations disappear, they couldn’t muster a shift into the best performing sector for the past 18 months.
To end the quarter, the financials wobbled sideways but slowly moved lower. On Friday June 17th, the bank ETF closed at new 52-week lows. Commodity stock markets like Australia and Canada dropped meaningfully as oil names sold off hard. Oil stocks quickly plummeted for 10 days from new highs to their 200-day moving averages, casting down 25%. The technology names continue to be sold as inflation roars. The Fed is speeding up their time line for rate hikes as the economy slows quickly under the pressure of firm gasoline prices and rising food prices.
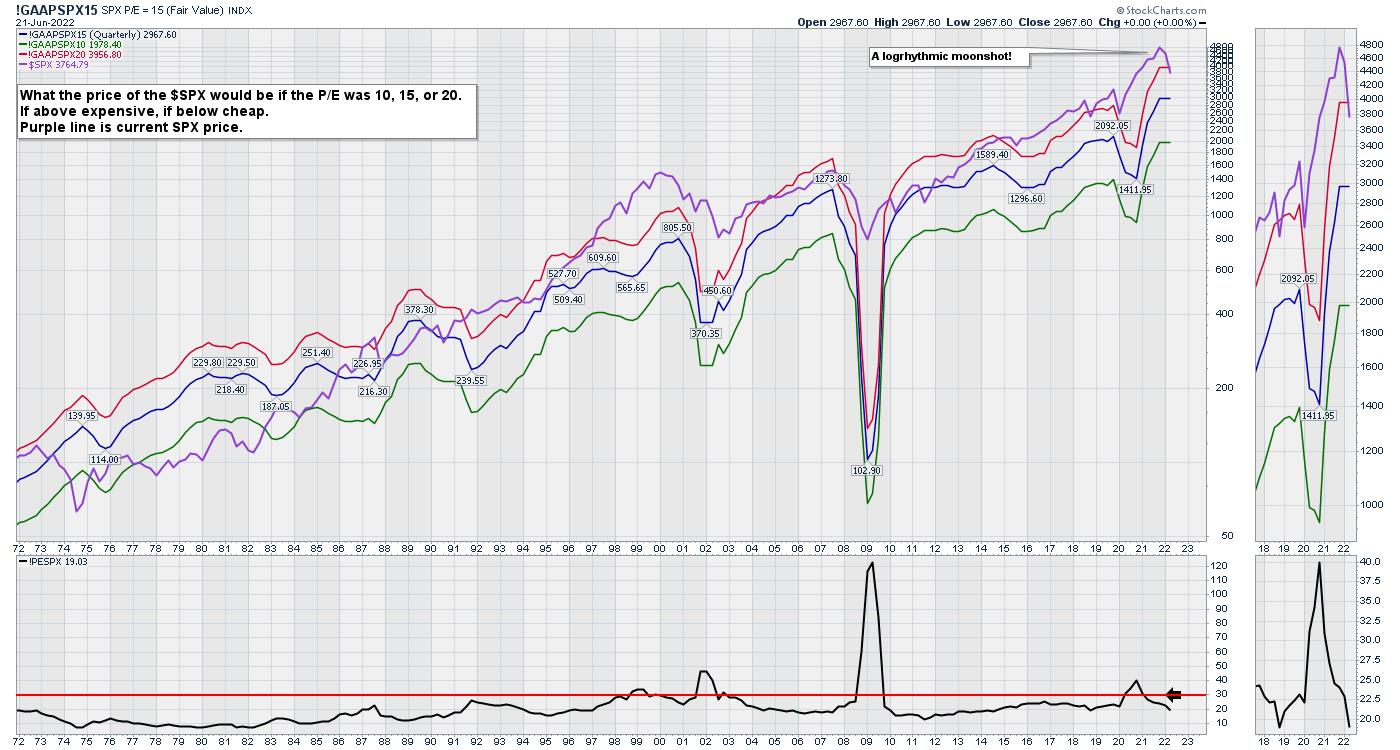
What’s next?
The graph below shows the stock market price/earnings ratio (P/E) ticking down over the past 6 months. The move down is a 20% drop from all-time highs. Because this is a 100-year chart, the log scale makes the move down look small. An arithmetic chart would show this as a 20% plunge of the entire chart height. With the Fed continuously providing a trampoline for the markets from 2008 to 2022, the market has stretched into higher and more extreme valuations compared to history. Since the early nineties, the market has hugged the red line a lot more than the middle of the range at the blue line. Now that we are below the red line, we are in a relative value area for investment managers as they have seen the market above the 20 P/E level most of their careers.
The next move for the market is unknown, but the fight between the headwinds of inflation forces and the desire for investment managers to make money before year end should be an epic battle. Throw in the US Mid-terms and that adds more pressure.
The strength indexes we use at the Osprey Strategic website to evaluate when to put money to work as trying to turn up. If you are interested in getting help evaluating the market, check out the one-month trial at $7 on the homepage of OspreyStrategic.org. We are looking for the fourth buy point of the year right now. The last three were very short. Will this one be the one that extends into the next bull market?