We think it is a good time to review bear markets, since we just had one, or are still in one, depending on the definition you choose to use. It is generally accepted that a bear market occurs when the stock market is down at least 20% from recent highs. There seems to be less agreement; however, on when the bear market is officially over. Some will say the bear market ends when the indices are no longer down 20% from those highs, some say it’s when indices are more than 20% from the lows, while others say it ends when stocks fully recover and make new all-time highs. We think the latter definition of when the bear market ends is the most appropriate.
The stock market can exhibit all sorts of patterns when making a recovery from a bear market low. Think about the labels the pundits have been discussing on TV regarding the shape of this bear market – will it be “V-shaped”, or “U”, “W”, “L”, “swoosh”, etc.? All of those names signify some sort of recovery and an end to the bear market. At least the “V”, “U”, and “W” shapes seem to indicate that you need to get back as high as where you started – with ending points at the same level as beginning points – this aligns with our preferred definition of when bear markets end.
But those aren’t the only shapes the recovery can take. Imagine a different shape – how about a “radical” bear market? The radical symbol, used to designate the square root of a number, looks like this:

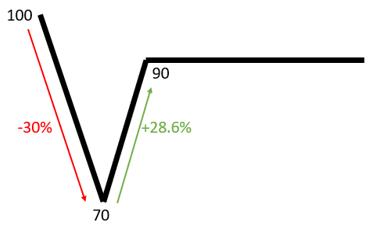
If we modified that symbol slightly, by starting at a higher point and having the horizontal line remain lower than the starting point, like this picture below, what market scenario would that describe?

One example of this could be that the market sells off about 30%, then rallies 28.6%, then trades in a sideways pattern for a period of time. Example chart below:

A recovery of this shape would meet the first 2 definitions of the end of the bear market, as the market would no longer be 20% below the recent highs and also is more than 20% above the low point. If you were a buy & hold investor through this type of market, would it feel like the bear market is over? We doubt it. While you may be happy that your accounts have recovered so much from the lowest point, you would also be aware that you are still down 10% (i.e., you’ve lost 10% of your money), and are probably frustrated that so much time is passing while not being able to achieve any new gains.
As we’ve stated in a previous article (https://stockcharts.com/articles/dancing/2019/10/trend-and-trend-plus-drawdown-863.html), the duration of the drawdown may end up being just as important to an investor as the magnitude of the drawdown. If the sideways market goes on for a long time, even if you’re not down that much, you may still consider abandoning your investment plan and putting your money to work in other areas that seem to be able to generate a return.
Remember, the goal of investing is not to break-even but to make a return (i.e., new gains); therefore, we don’t think the bear market is over until that happens. This is why we think that the correct definition for the end of the bear market is when the indices fully recover and notch a new all-time high. That’s the point at which investors feel relieved that they have survived the bear market and can start making new money. This definition is also the only one that can be applied consistently to recoveries of any shape. For example, if the market where to drop 20% from where we are currently, people who use the other definitions of a bear market would have to consider it as a separate bear market from the one that started in February.
Given our preferred definitions of what constitutes a bear market (20% below recent high) and when a bear market ends (when a new high is made), let’s look at the bear market we are currently in compared to others in history.
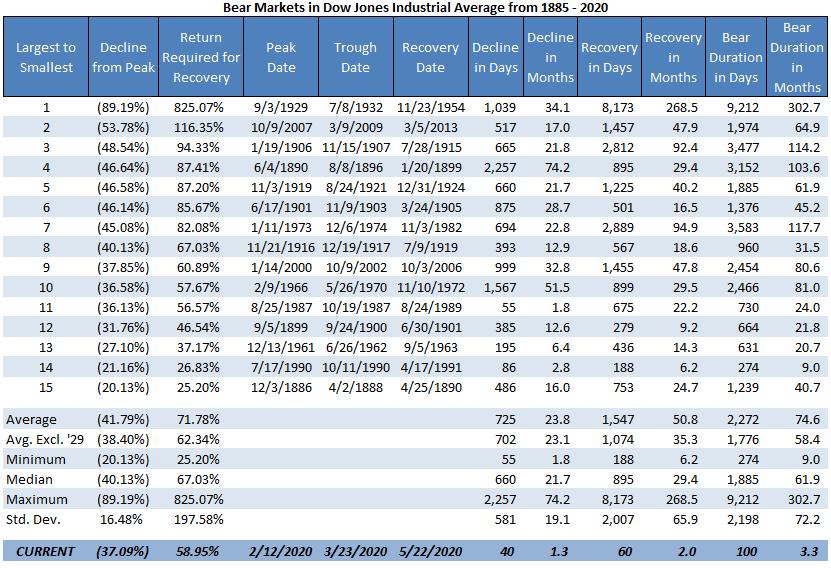
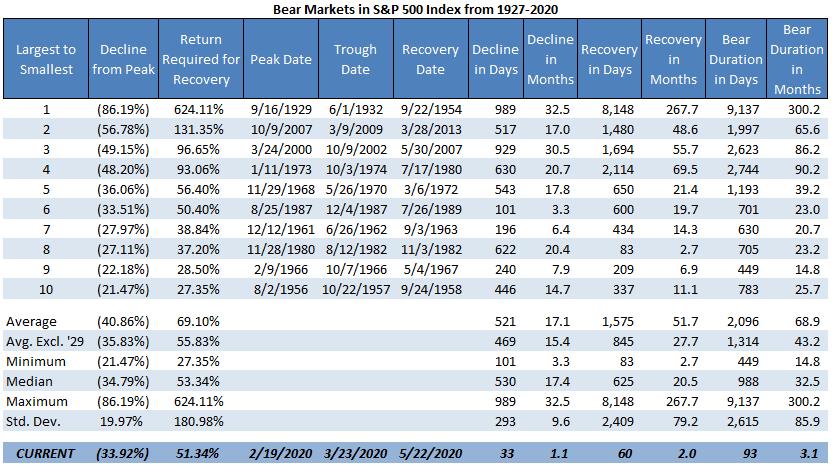
We’ll start out by showing you lots of data on previous bear markets. Below are two tables showing the bear market statistics for the Dow Industrials beginning in 1885 (Table A) and the S&P 500 beginning in 1927 (Table B).

Table A

Table B
These two indices are generally tracked as the “market” when looking at U.S. stocks. The terms in the tables are simple enough, but so there is no confusion on the dates we’re measuring from; “Peak Date” is the high point prior to the bear market, “Trough Date” is the lowest point in the bear market, “Recovery Date” is the date at which the market achieves a new all-time high after being in a bear market, “Decline” is the period between Peak Date and Trough Date, and “Recovery” is the period between Trough Date and Recovery Date. We’ve included the 2020 bear market at the bottom of each table, based on where we sit as of the most recent trading day of May 22nd. The trough date of March 23, 2020 assumes that we will hit a new high and recover from the bear market prior to hitting a lower low than what we saw on that date. We will only know in hindsight if that will be the case.
The data on past bear markets shows that the quickest decline in the S&P 500 (Table B) took 101 days in 1987, while the average decline of the previous 10 bear markets in the S&P 500 took 521 days – that’s close to a year and a half – and that’s just the time it took to reach the bottom. It is a very painful process to invest for over a year and continually lose money. In contrast, the 2020 decline only took 33 days (provided that we continue the recovery and don’t hit a new low) – this bear market decline was so fast that it hardly showed up on investor’s monthly account statements before the recovery was underway.
The average time for the S&P 500 to recover from the trough to a new high was 1,575 days or, if we exclude the crash of 1929, which seems to be an outlier, the average recovery still took 845 days (more than 2 years)! The average total length (duration) of the past bear markets in the S&P 500 (excluding 1929) was 1,314 days, or more than 43 months. The bear market of 2020 has lasted just 93 days so far – and if it fully recovers any time soon, it will go down in history as the quickest bear market we’ve ever had. An exceptional bear market, indeed.
If the quick recovery occurs, many will espouse the merits of buy & hold investing, citing this bear market as an example of why it is better to stay invested through the market downturns. Even if the market does fully recover soon, it doesn’t change the fact that having your investments go down 34%, with no guarantee that they will recover quickly, is still a very painful experience. By the way, the recovery is certainly not in the bag, yet! The S&P 500 is currently down about 12.7% from the February highs and the Dow is down 17.2%. Investors are still trying to get back to even. We’ll wait to see what happens, but fortunately, our trend following approach did not suffer anywhere near the level of drawdown that passive investors experienced.
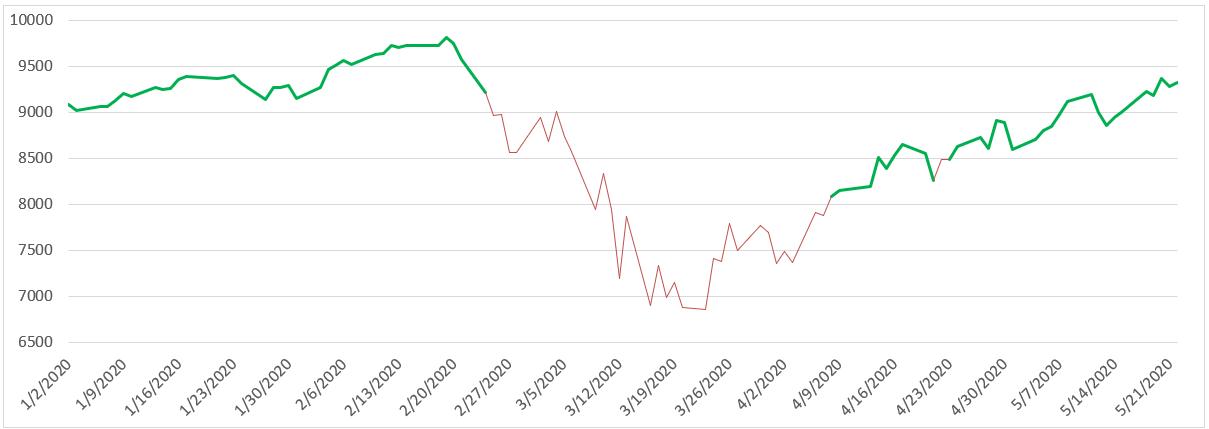
Our trend following model is very focused on risk management and avoiding the devastating losses of bear markets. Even though this bear market is shaping up to be different than any other in history, our approach did not disappoint and allowed us to avoid material losses. Chart A shows the Nasdaq Composite for 2020, colored green when our model had us invested and red when it had us defensive.

Chart A
We never get out at the top and never get in at the bottom, rather we get out when the uptrend breaks down and get back in when there is evidence of a new uptrend in place. Trend following doesn’t guess!
Even though we are still in a bear market, the fact that an uptrend is in place has allowed us some participation in the market recovery. We will never capture all of the upside, as that is impossible unless you’re willing to capture all of the downside too. The biggest difference between our approach and a buy & hold strategy is that our accounts did not lose much when the market rolled over – so we very quickly started making new money with the new uptrend, as opposed to just recovering losses.
It is times like this that being a rules-based trend follower really pays off. We don’t have to listen to the ever-droning financial news media or listen to all the experts guessing about what the market is going to do, or what shape the bear market recovery will take (as if anyone knows). We face no uncertainty in how to execute, even in uncertain times – we just follow our model with extreme discipline.
If you are interested in incorporating trend following or tactical investment management into your investment plan, you can reach out to Grant directly by email (grant@mscm.net). Grant manages various tactical and trend following strategies at McElhenny Sheffield Capital Management for individual investors and other advisors, and Greg is a senior advisor to the firm.
Dance with the Trend,
Greg Morris
Grant Morris