Most of my conversations this week on The Final Bar were related to the tactical upswing in risk assets this week, paired with the realities of a long-term bear market phase. At what point does the market rally enough that a short-term gain becomes more of a long-term recovery?
Well, first we would need to see stocks not just rallying off extreme low levels, but actually making new swing highs and higher lows. Cruise lines like RCL are a perfect illustration of buyers coming in on extreme weakness.
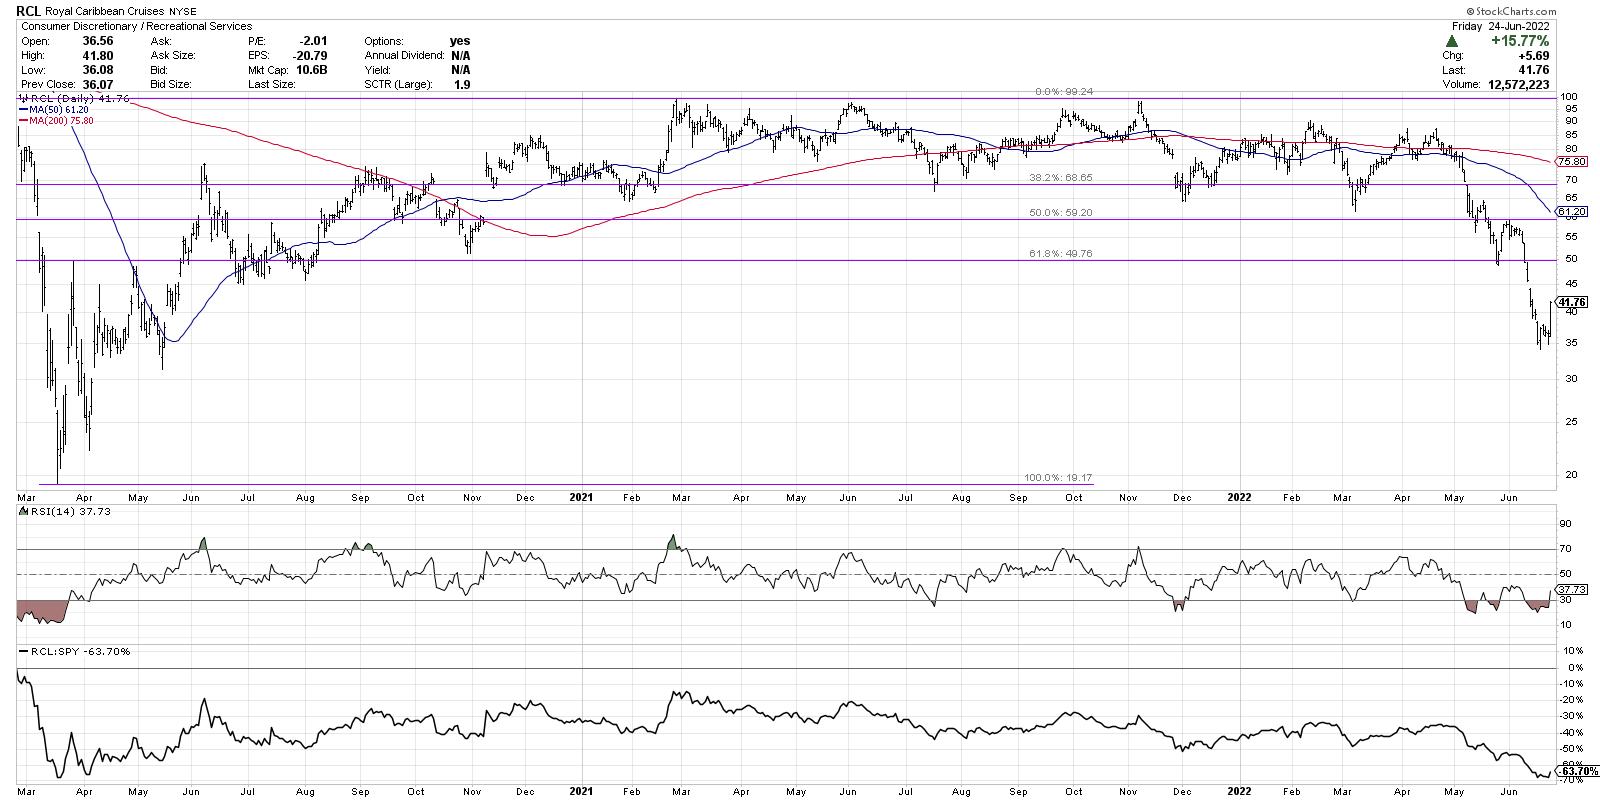
While the short-term strength here is certainly impressive (up over 15% on Friday!), the stock is still down 46% for the year. Bear market rallies can be sudden, severe and seductive. Bull market rallies, by contrast, take time to develop and be confirmed!
If the markets would establish a bear market bottom in June and begin to move higher, where would we expect to see leadership? This is where I like to reflect on Sam Stovall’s idealized chart of sector rotation, found on our Sector PerfChart page on StockCharts.
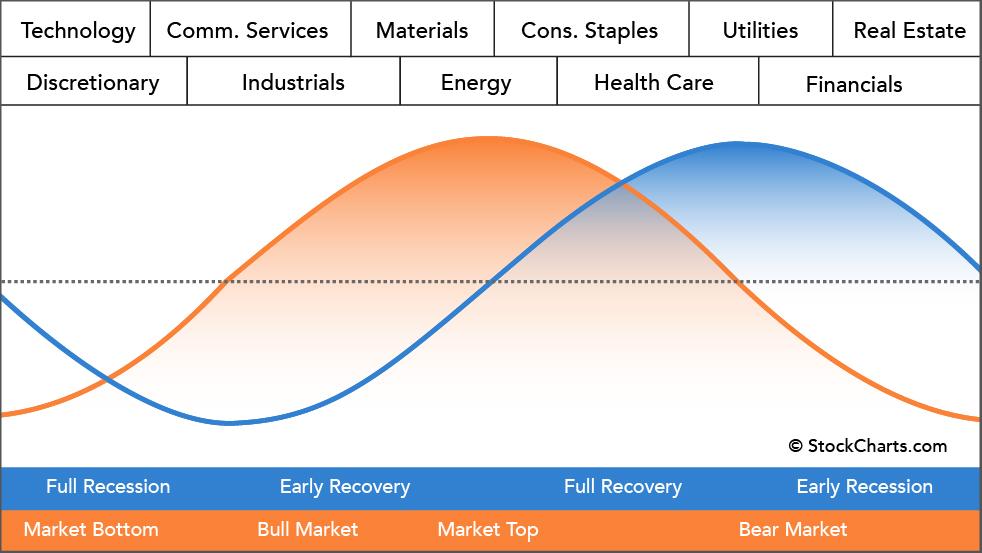
Once a market bottom has occurred, and a new uptrend is beginning, the two sectors that tend to lead are Technology and Consumer Discretionary. These growth-oriented sectors tend to take over leadership from defensive sectors like Utilities and Real Estate, as investors rotate to a more “risk on” positioning.
Let’s review the chart of the Technology Sector SPDR and evaluate the trend and relative strength.
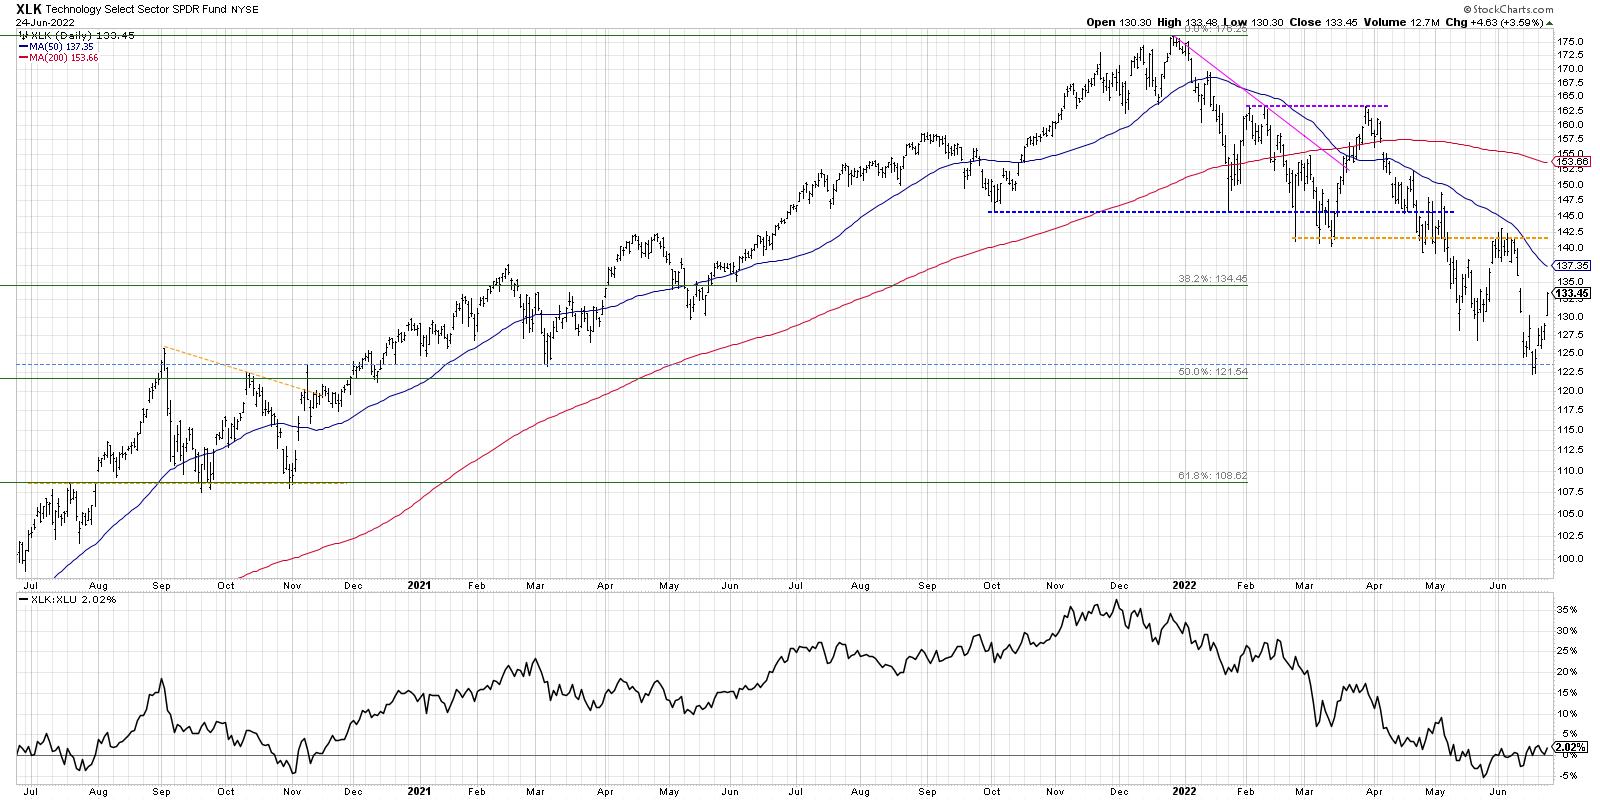
Notice how 2022 has been marked by frequent breakdowns of established support levels. The October 2021 low was retested a number of times before finally being broken in May 2022. The March lows were retested from below in early June before XLK resolved to the downside. We have seen a consistent pattern of lower lows and lower highs, mirroring Charles Dow’s classic definition of a downtrend phase. So while this week’s bounce was a strong one, the price is still well below its recent high around $142. I would need to see a break above that previous resistance level to confirm a bullish rotation.
At the bottom of that chart, we’re showing the relative strength of Technology (XLK) vs. Utilities (XLU). This is a brilliant way to demonstrate a potential rotation from bear market leadership to new bull market leadership. Here, we see that the ratio has been trending higher, favoring Tech over Utes, for the last four weeks. To complete a bullish rotation, this ratio would need to continue higher to demonstrate emerging strength in Technology as investors “step on the accelerator” and take on additional risk.
I would also point out that there is very little chance that our major benchmarks could mount any significant rally without the support of the FAANG stocks, due to their outsized influence on the indexes.
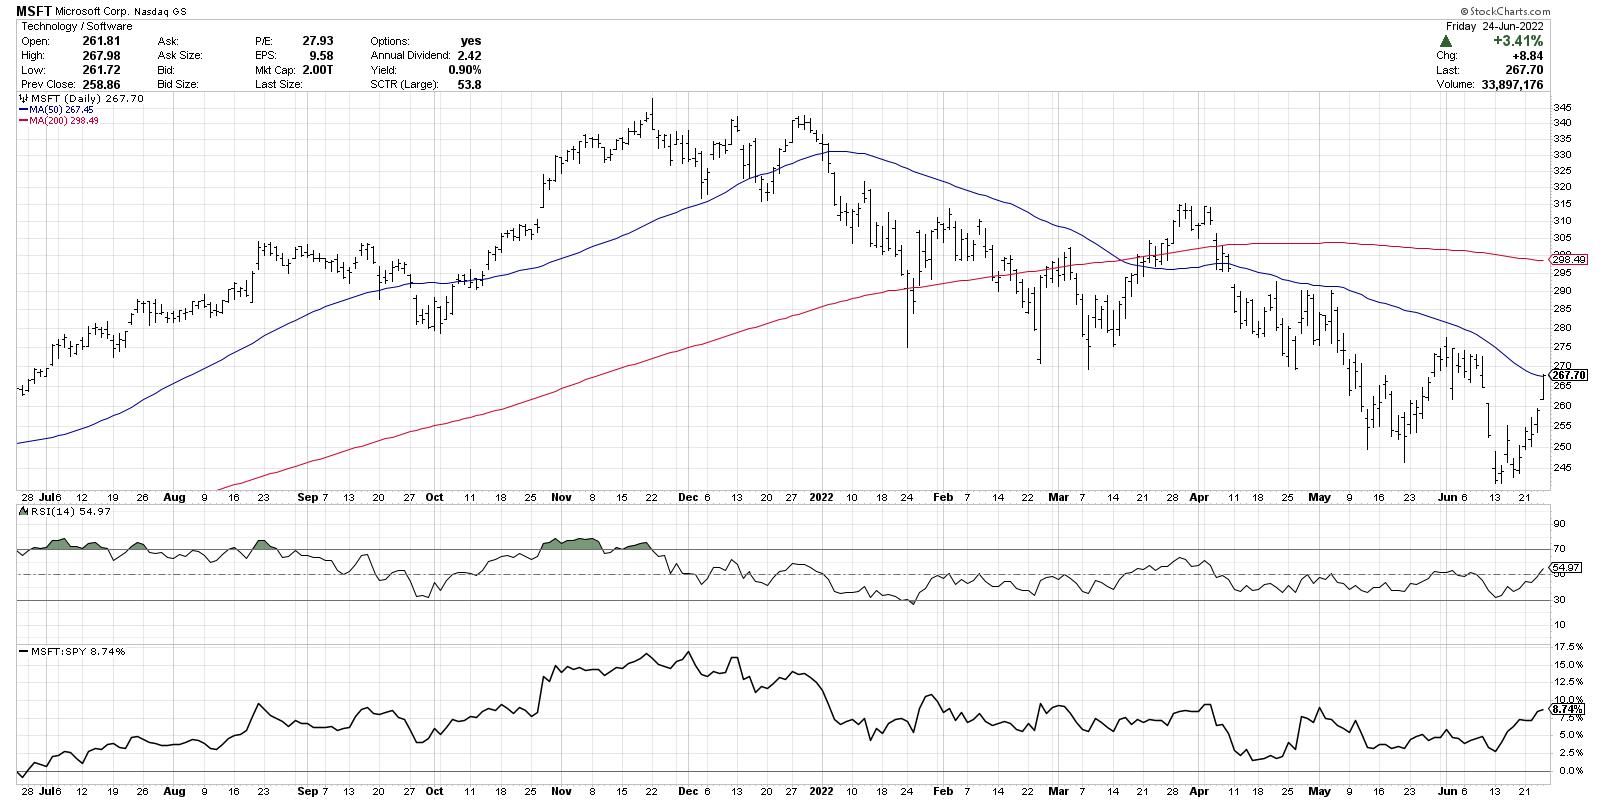
After a strong upside reversal this week, MSFT is once again testing its 50-day moving average from below. Can the price solidify a confirmed break above this level? If so, can MSFT clear its previous swing high around $275? What about the 200-day moving average, currently just below $300?
The most important indicator on the Microsoft chart would be the RSI, which has been in a bearish phase for all of 2022. Strong charts have strong momentum. MSFT is still showing momentum readings characteristic of a bear market phase! Look for the RSI to get above 60 to confirm an influx of buyers. Signals like that in names like MSFT could confirm enough buying power to propel the major averages into a new bull market phase.
Want to digest this article in video format? Head over to my YouTube channel.
RR#6,
Dave
P.S. Ready to upgrade your investment process? Check out my YouTube channel!
David Keller, CMT
Chief Market Strategist
StockCharts.com
Disclaimer: This blog is for educational purposes only and should not be construed as financial advice. The ideas and strategies should never be used without first assessing your own personal and financial situation, or without consulting a financial professional.
The author does not have a position in mentioned securities at the time of publication. Any opinions expressed herein are solely those of the author, and do not in any way represent the views or opinions of any other person or entity.