When the pandemic first began around mid-March 2020, firms across the country and across industries shut down or drastically reduced operations, leading to sharply lower volumes for many rail traffic categories. A year later, rail traffic has rebounded, leading to year-over-year volume percentage gains that in some cases reflect easier comparisons more than underlying market factors.
March’s rail traffic numbers are impacted by the easier comparisons. Total U.S. carloads were up 4.1% in March 2021 over March 2020, their first year-over-year monthly gain since January 2019. Total carloads in the last two weeks of March were up 7.3% over the comparable weeks of 2020.
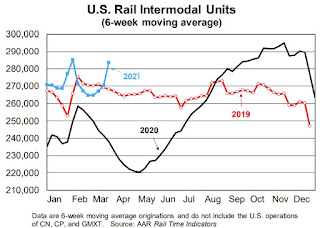
For intermodal, U.S. volume in March 2021 was up 24.0% over March 2020. That’s the biggest monthly gain ever for intermodal; it includes a 28% increase in the last two weeks of March. March’s intermodal gains are not solely a function of easy comparisons, though: March 2021 was the highest volume March ever for intermodal and the sixth-best intermodal month overal
emphasis added
Click on graph for larger image.
This graph from the Rail Time Indicators report shows the six week average of U.S. Carloads in 2019, 2020 and 2021:
Total carloads averaged 231,232 in March 2021. That’s a higher weekly average than March 2020, but otherwise it’s the lowest weekly average for any March since 1988, when our data begin. For the first three months of 2021, total U.S. rail carloads were 2.6% (77,267 carloads) lower than they were in the first three months of 2020.
 The second graph shows the six week average of U.S. intermodal in 2019, 2020 and 2021: (using intermodal or shipping containers):
U.S. intermodal originations totaled 1.43 million in March 2021, up 24.0%, or 276,781 containers and trailers, over March 2020 and up 8.0% over March 2019. March 2021 marks the eighth-straight year-over-year gain for intermodal following 18 straight declines.
Note that rail traffic was weak prior to the pandemic, however intermodal has come back strong.