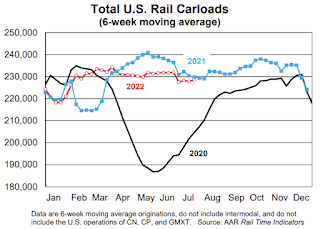
Rail traffic in July was evenly balanced between commodities with carload gains and those with declines. As such, it doesn’t provide definitive evidence regarding the state of the overall economy. Moreover, the traffic category historically most highly correlated with GDP is “industrial products,” a combination of seven other categories. Carloads of industrial products have fallen for four straight months, but the declines have all been extremely small.
emphasis added

This graph from the Rail Time Indicators report shows the six-week average of U.S. Carloads in 2020, 2021 and 2022:
In July 2022, U.S. railroads originated 906,903 total carloads — up 0.2% (2,213 carloads) over July 2021. The year-over-year gain was not large, but it was the first gain of any size in four months. Intermodal is not included in carload totals.

U.S railroads also originated 1.03 million intermodal containers and trailers in July 2022, down 3.0% (32,094 units) from last year. July marked the 11th decline in the past 12 months, but it’s also the smallest percentage decline in those 11 months.