This was well below consensus expectations for February. The weather was harsh in February – and probably played a role in the decline in sales – but the large year-over-year declines were in the West and Northeast. If the sales decline in February had been mostly weather related, we’d expect large declines in the mid-West and South regions (but sales were up year-over-year in those regions).
 Click on graph for larger image.
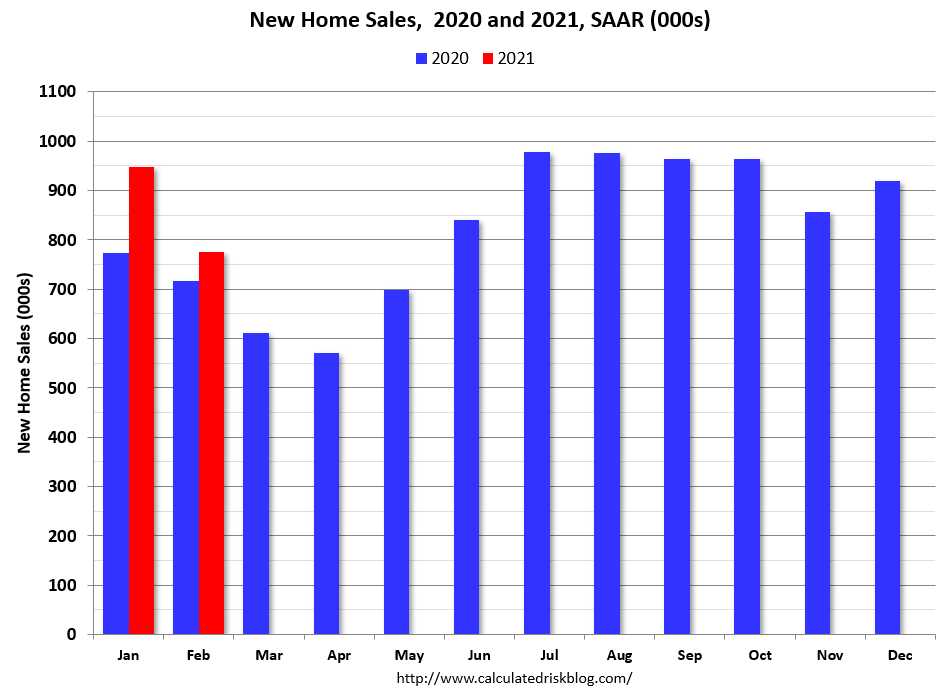
This graph shows new home sales for 2020 and 2021 by month (Seasonally Adjusted Annual Rate).
The year-over-year comparisons are easy in early 2021 – especially in March and April.
However, sales will likely be down year-over-year in August through October – since the selling season was delayed in 2020.
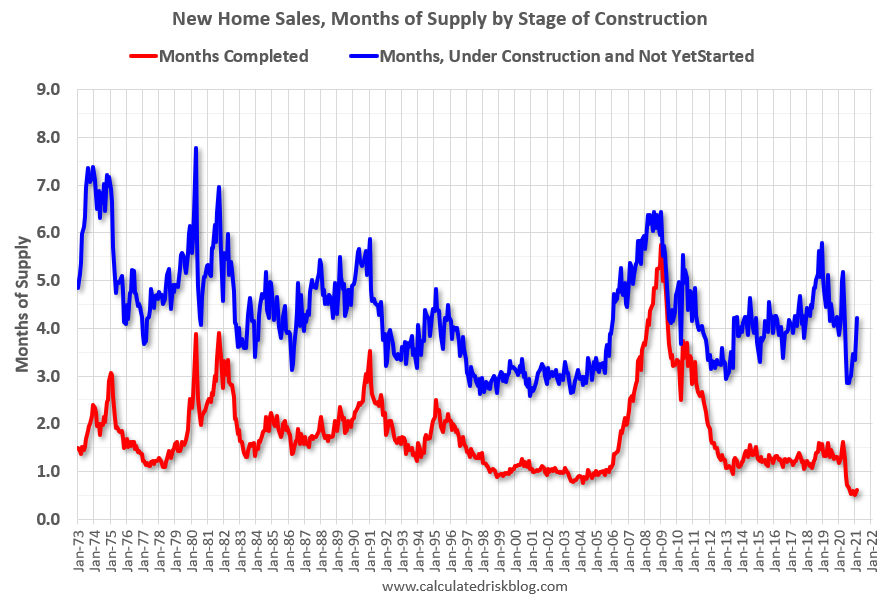
And on inventory: note that completed inventory (3rd graph) is near record lows, but inventory under construction is closer to normal.
 On inventory, according to the Census Bureau:
“A house is considered for sale when a permit to build has been issued in permit-issuing places or work has begun on the footings or foundation in nonpermit areas and a sales contract has not been signed nor a deposit accepted.”
Starting in 1973 the Census Bureau broke this down into three categories: Not Started, Under Construction, and Completed.
This graph shows the months of supply by stage of construction..
The inventory of completed homes for sale was at 40 thousand in February was just above the record low of 37 thousand in 2013 (when sales were much lower). That is about 0.6 months of completed supply.