On COVID (focus on hospitalizations and deaths):
 Click on graph for larger image.
| COVID Metrics | ||||
|---|---|---|---|---|
| Now | Week Ago |
Goal | ||
| Percent fully Vaccinated | 66.9% | — | ≥70.0%1 | |
| Fully Vaccinated (millions) | 222.1 | — | ≥2321 | |
| New Cases per Day3 | 97,548 | 102,042 | ≤5,0002 | |
| Hospitalized3🚩 | 24,950 | 24,513 | ≤3,0002 | |
| Deaths per Day3 | 283 | 291 | ≤502 | |
| 1 Minimum to achieve “herd immunity” (estimated between 70% and 85%). 2my goals to stop daily posts, 37-day average for Cases, Currently Hospitalized, and Deaths 🚩 Increasing 7-day average week-over-week for Cases, Hospitalized, and Deaths ✅ Goal met. |
||||
 Click on graph for larger image.
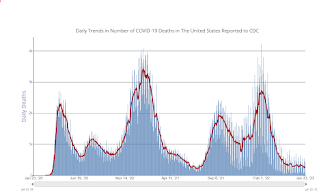
This graph shows the daily (columns) and 7-day average (line) of deaths reported.
Average daily deaths bottomed in July 2021 at 214 per day.