Many investors wonder if the recent rally has legs, with the S&P 500 down 25% YTD. Unfortunately, only time will tell if Monday’s rally is a dead cat bounce or a more sustainable uptrend.
The market depends on many factors, but investors should always pay close attention to the overall daily price moves of the major US indexes. Are the indexes closing with higher bottoms than the previous day’s price or last week’s market close? Are the major indexes closing at lower lows than the previous day or weekly? If the price trend is down, there is a potential danger of more significant declines.
The daily closing prices of the market offer helpful direction, but these four indicators might assist you in reading the daily market price action. They should warn you of a potential selloff or indicate if this rally has more room to go. These indicators are junk bonds, 20+ year treasuries, sugar futures and the VIX.
Here’s a closer look at each.
Investors need to be aware of many risks. Inflation has remained stubbornly high, the Fed is raising rates aggressively, corporate earnings are declining, and high mortgage rates have caused the housing market to cool, to name a few.
Junk bonds can indicate where the stock market is heading. That’s because they’re more sensitive to changes in interest rates than other types of bonds. When junk bond prices start falling, it’s often a sign that investors are losing confidence and are looking for safety trades. So, if junk bonds start to fall in value, it’s a good sign that the stock market might fall.
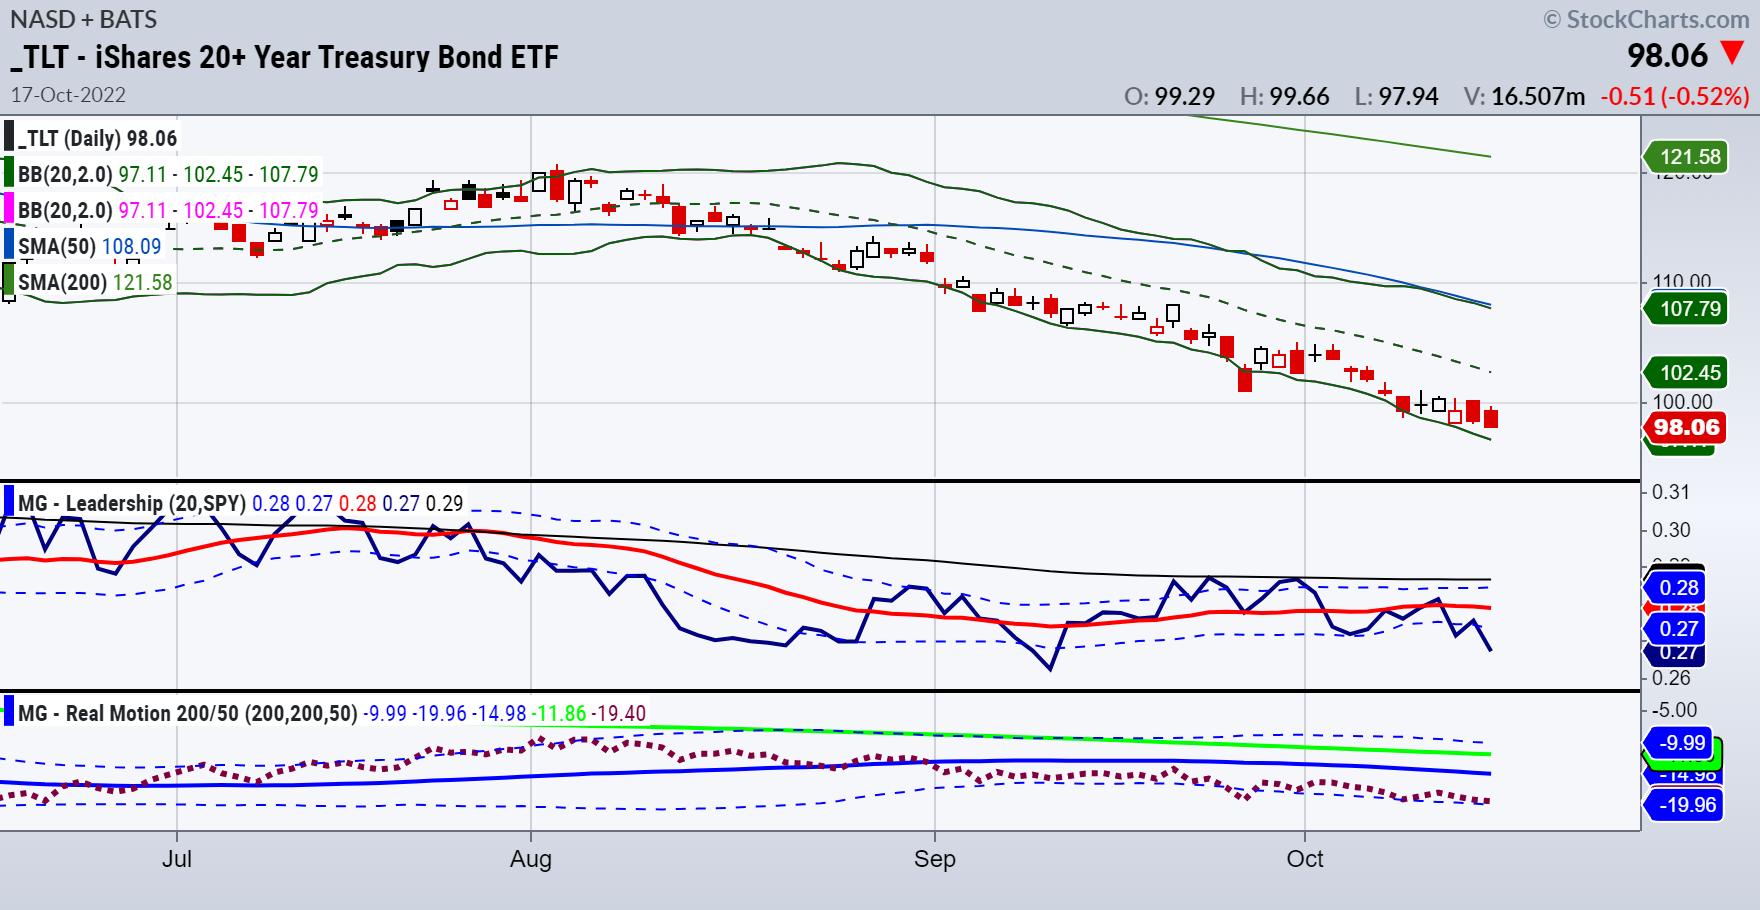
Treasuries are also affected by changes in interest rates, but they’re not as sensitive as junk bonds. That means they can be an excellent leading indicator of where interest rates are headed. If treasury yields continue to rise, it’s a sign that the stock market might sell off as a result. So watch the price of TLTs since price and yield have an inverse relationship.
Sugar futures are often used as a proxy for the overall commodities market. And like other commodities, sugar prices are closely linked to changes in inflationary pressure. So, if sugar prices start to rise, it’s usually a sign that inflation is picking up, and the stock market might move in the opposite direction.
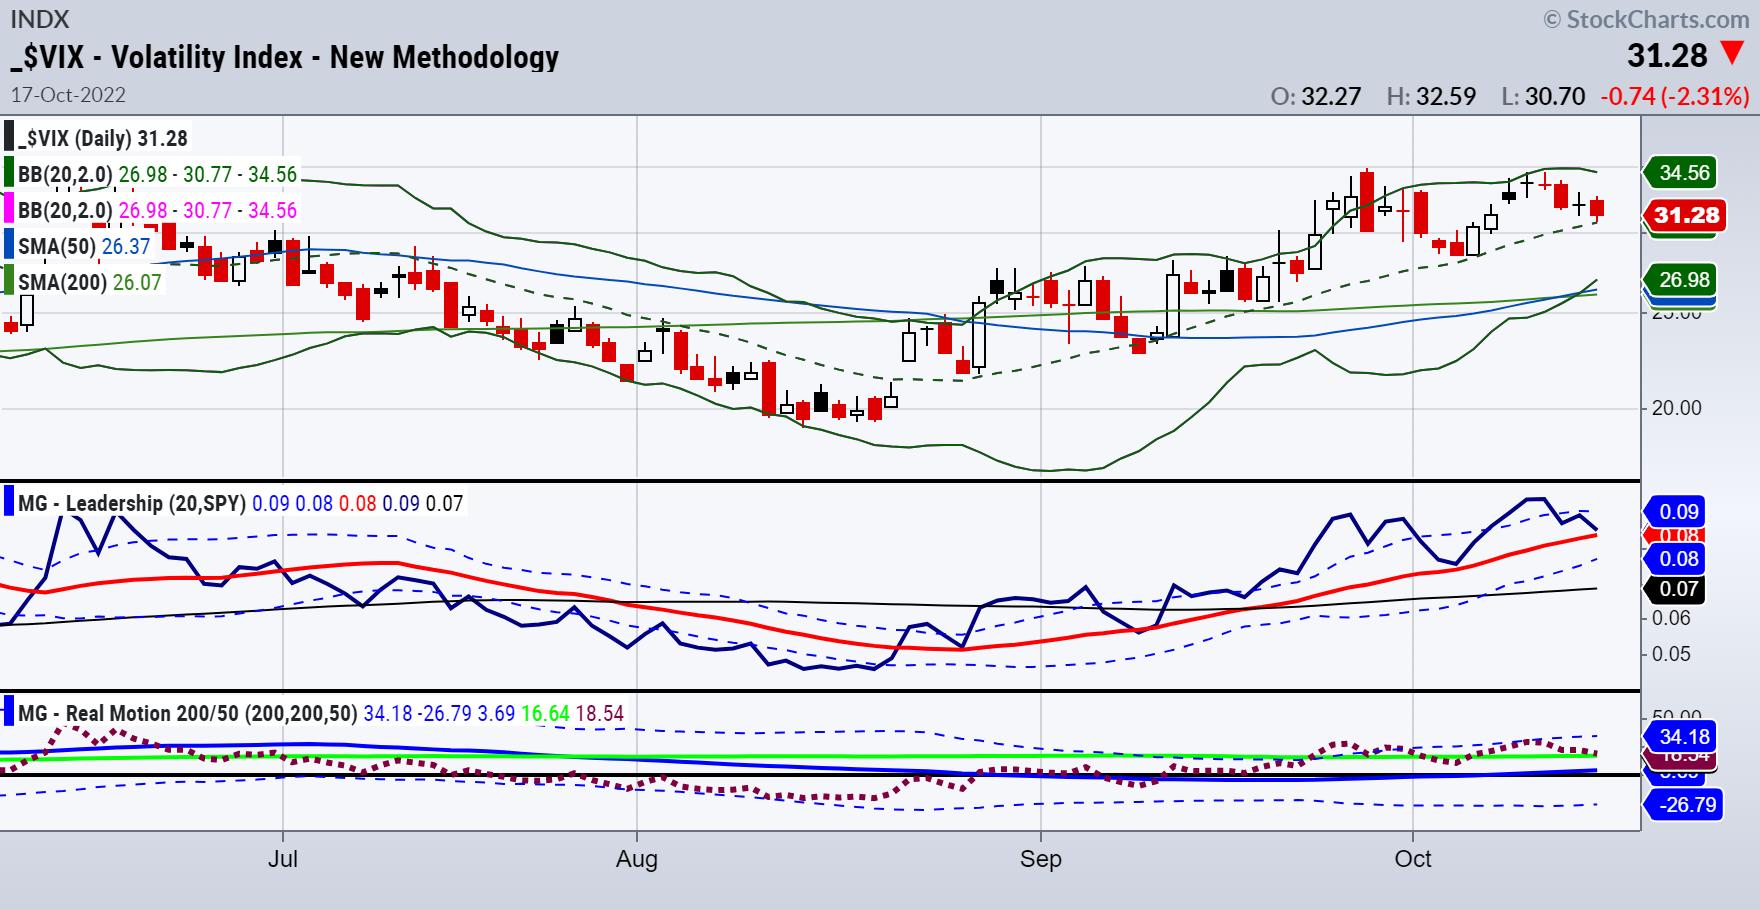
The VIX is often called the “fear index” because it measures how much volatility investors expect over the next thirty days. Now, investors are bracing for more turbulence, since the VIX is above 30. For the current bounce to have legs, the VIX needs to moderate to the mid-20s from around the current 30-plus level.
Of course, no indicator is perfect, and you should also consider the direction of the overall indexes daily when making trading decisions, plus the specific price movement of individual securities. To see a quick video of Mish describing these outliers with chart analysis, please click this link or watch below.
Subscribe to Mish’s Daily for additional market insights and stay up to date on market moves.
You can also sign up for a free consultation with Rob Quinn, our Chief Strategy Consultant, by clicking here to learn more about Mish’s top-rated risk management trading service.
Mish’s Upcoming Seminars
The Money Show: Join me and many wonderful speakers at the Money Show in Orlando, beginning October 30th running thru November 1st; spend Halloween with us!
Trader’s Summit: Mish speaks with Helene Meisler on October 23rd at 12pm ET. Learn more here.

Follow Mish on Twitter @marketminute for stock picks and more. Follow Mish on Instagram (mishschneider) for daily morning videos. To see updated media clips, click here.
Mish in the Media
Has the market bottomed? Where should passive investors go to be safe? Mish digs into these questions and more on Coast to Coast with Neil Cavuto.
Mish and Scott discuss a possible soft landing but with loads of headwinds to watch for on RFD-TV’s Cow Guy Close.
Mish covers bonds, sugar futures, the US Dollar, and volatility on the Monday, October 17 edition of StockCharts TV’s Your Daily Five.
With BNN Bloomberg, Mish discusses the markets as U.S. banks reported earnings and why it’s important to watch long-term bonds and the stability investing in the sugar trade.
The 6-7 year business cycle in the “inside” sectors of the U.S. economy is facing a huge test, as Mish discusses on NASDAQ Talks.
Watch some select clips from Mish at ChartCon 2022!
Mish and Nicole talk risk, inflation, long bonds, dollar and where you can park some money on TD Ameritrade.
Read Mish’s latest article for CMC Markets, titled “Earnings, Inflation and Retail, Oh My!“.
ETF Summary
- S&P 500 (SPY): Reached the 50% Fibonacci level from the March 2020 lows on Thursday, at 351, then rebounded sharply. Under 3510, support 330 and, on the upside, resistance 360, 370, 382 and 396.
- Russell 2000 (IWM): 162.50 support, 177 resistance.
- Dow (DIA): 285 support, 305 resistance.
- Nasdaq (QQQ): 255 support (could go to 220), 270 resistance.
- KRE (Regional Banks): 56 support, 60 pivotal, 65 resistance.
- SMH (Semiconductors): 167 support, 190 resistance.
- IYT (Transportation): 195 support, 207 resistance.
- IBB (Biotechnology): 116.00 support, 124 resistance.
- XRT (Retail): 54-55 support, 62 resistance.
Mish Schneider
MarketGauge.com
Director of Trading Research and Education
Wade Dawson
MarketGauge.com
Portfolio Manager