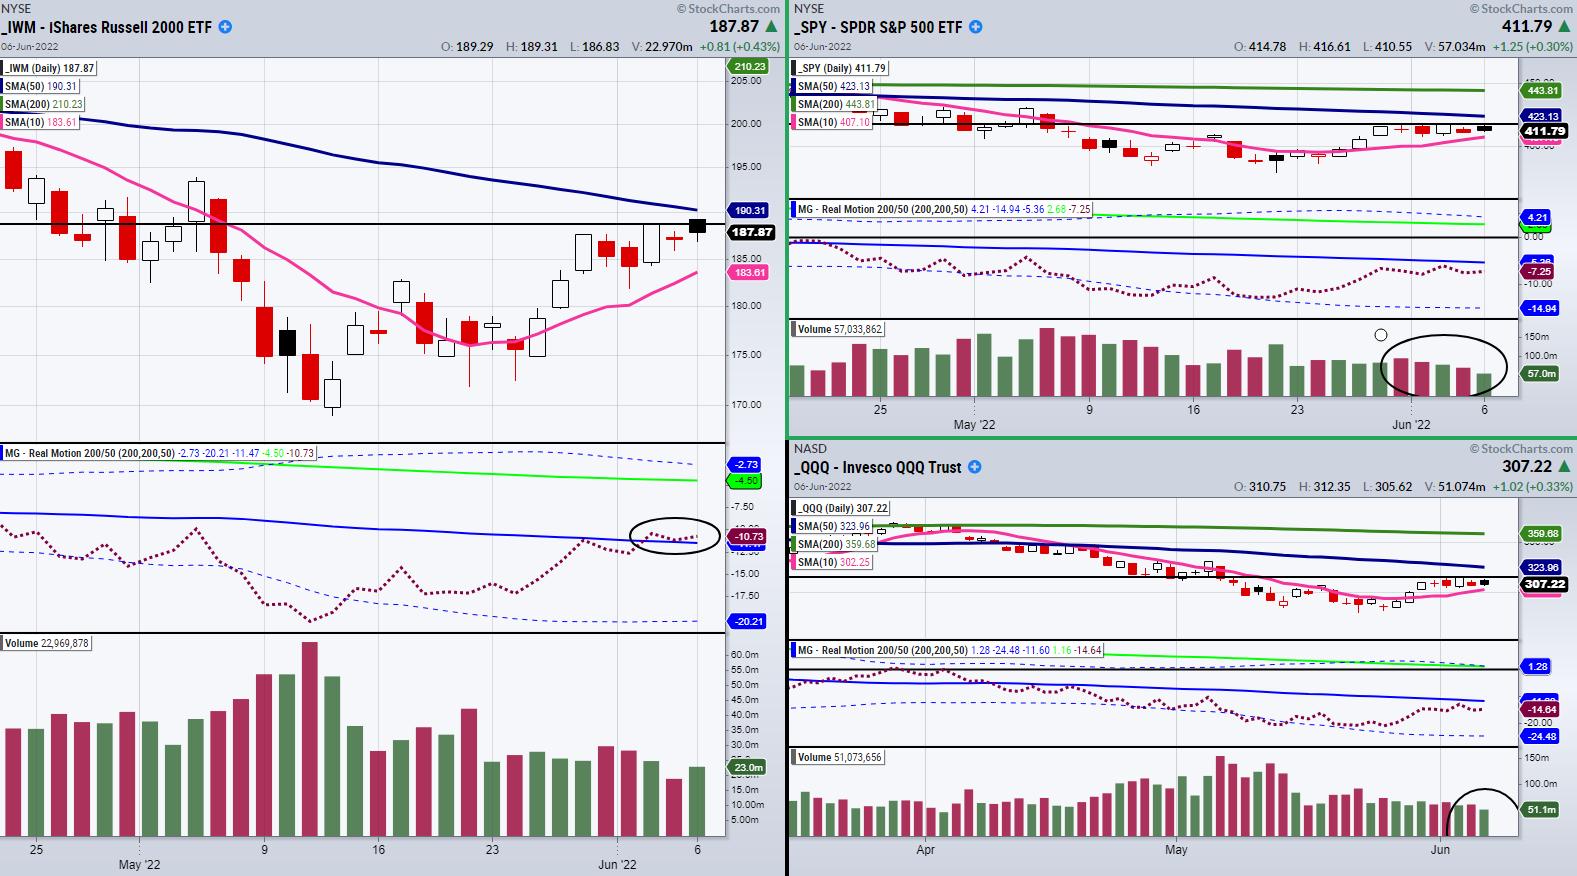
Currently, the small-cap index Russell 2000 (IWM) is leading in momentum compared to the S&P 500 (SPY) and the Nasdaq 100 (QQQ). Looking at our Real Motion momentum (RM) indicator found in the above charts, we can see that RM is barely leading over the 50-DMA, while the price is still under its 50-DMA at $190.30 in IWM. While this is a hopeful sign, the downside is that IWM failed to hold over last Thursday’s high of $188.76.
Last Thursday is an important day for each of the indices, as it represents the high of the current consolidation area. This is a resistance level to watch for each index to clear if the market is going to take another step higher. With that said, let’s analyze what to look for next in the SPY and QQQ, along with the subtle clues volume can give, when watching for the next big price move.
Looking at the SPY, if we want to clear our mini-consolidation area, we will need to pass $417.44. If this price level does clear, we can next look for momentum to follow, with RM clearing over its 50-DMA.
When using RM as a trade confirmation indicator, it helps to wait for both price and RM to align, meaning that both price and RM will have to trade over its 50-DMA to show agreement. The same goes for the tech-heavy Nasdaq 100 (QQQ), which also has RM and price underneath its 50-DMA. With that said, let’s turn our focus to volume.
Notice that across the board volume is lower than average. This is one reason why Monday’s attempted breakout in IWM didn’t work. While low volume is fine for consolidation areas, when looking for meaningful breakout days, it helps if a pivotal price is cleared along with increased volume. Price will often continue in the breakout direction if accompanied by high volume.
Therefore, we have 3 things to watch for when looking for the next major market move to the upside. Big volume days, momentum confirmation and for our pivotal price levels to clear and hold over Thursday’s high of last week.
Follow Mish on Twitter @marketminute for stock picks and more. Follow Mish on Instagram (mishschneider) for daily morning videos. To see updated media clips, click here.
On the latest edition of StockCharts TV’s Mish’s Market Minute, Mish debunks the wishful thinking that inflation has peaked. She shows that, though inflation has cooled, there are still a lot of different areas where prices continue to soar. She first examines the “Federal Reserves playground” with long bonds, then takes a deep dive into commodities, energy, metals and more.
Sign up for Mish’s virtual money show, coming this Thursday the 9th!
ETF Summary
- S&P 500 (SPY): 417.44 to clear.
- Russell 2000 (IWM): 188.76 to clear and hold.
- Dow (DIA): 334.73 the 50-DMA resistance.
- Nasdaq (QQQ): 314.56 resistance.
- KRE (Regional Banks): 65 resistance.
- SMH (Semiconductors): 248.35 17-week exponential moving average.
- IYT (Transportation): 235.70 pivotal area.
- IBB (Biotechnology): 112 support area.
- XRT (Retail): 68 to clear.
- GLD (Gold): 171.89 pivotal.
- USO (Oil): Inside day.
- DBA (Agriculture): 22.18 the 50-DMA. 21.80 support area.
Forrest Crist-Ruiz
MarketGauge.com
Assistant Director of Trading Research and Education